¶ Introduction
¶ Purpose, Objective and Scope
This document aims to list and analyze the results obtained during the buckling test of the firehorn test modules.
It covers the results of the test and their analysis.
It does not cover the Test Specification and Procedure (TSP)
¶ Test Documenation
There are 2 main types of documents which relate to testing activities.
¶ TSP
-
Test specification section explains:
- What part/assembly is being tested during each test.
- What characteristic is being tested.
- Brief description as to how the test is goind to be conducted.
- Explains the Pass/Fail criteria for each step.
- Explains when the test is due to happen and who will be involved in the test.
-
Document should be prepared after the baseline AI&T and ~1 month before the actual test.
-
Test procedure serves as a detailed plan for each individual test, it contains (among other things):
- A list of tools and instrument needed for the test.
- A description of the test location and condition.
- A step by step procedure of what needs to be done before, during and after the test.
-
Document should be prepared after the test specification and at least ~1 week before the actual test.
¶ TR
- The test report contains:
- The "as run procedure", meaning the procedure as planned ~1 week before the test with all of the comments and modiciations which were done the day of the test.
- The results of the test and all of the test data (or at least a link to the test data).
- If applicable, the analysis of the test data.
- The conclusion.
- The baseline document should be prepared the day of the test and the final version should be ready ~1 week after the test
¶ Definitions and Abbreviations
- ST : Structure
- FoS : Factor of Security
- ERT : EPFL Rocket Team
- TSP : Test Specification & Procedure
- CFRP : Carbon Fiber Reinforced Polymer
- GRP : Glass Reinforced Plastic
- FEA : Finite Elements Analysis
- ABR : Anti-Buckling Ring
¶ Applicable and Reference Documents
 2024_C_ST_INTERNAL-STRUCTURE_DDF
- 2024_C_ST_MODULE_FEA
- 2024_C_ST_NON_LINEAR_BUCKLING_MODULE_FEA
- 2024_C_ST_BUCKLING-MODULE_TSP
- Photos/videos
- Data
¶ Requirements to be verified
- 2024_C_SE_ST_INTERNAL-STRUCTURE_REQ_05
Axial compression
The internal structure shall withstand [15000]N of compression without failure.
- 2024_C_SE_ST_INTERNAL-STRUCTURE_REQ_06
Buckling
The internal structure shall withstand [15000]N of compression without loss of stability (buckling).
¶ As Run Test Procedure
¶ Test Data
The data is divided in two: some comes from the machine that gave the displacement and the force, and the rest comes from one to four sensors that were placed on the modules and gave the displacement.
Photos and videos are available on this link :
¶ Test Results
Tests were conducted on three different modules. The first module measured 350 mm in height, had no ABR, and served as the reference. The second module also measured 350 mm but included an antibuckling ring, while the third module measured 700 mm in height and featured two ABRs. For each module, an acceptance test was conducted to validate the structure under flight loads, and a qualification test was performed to determine the structure's limits and compare the results with the simulations.
¶ Acceptance Test
Load : 15 [kN]
Time : 60 [sec]
Goal : Validate the structure under flight loads
¶ Data Analysis
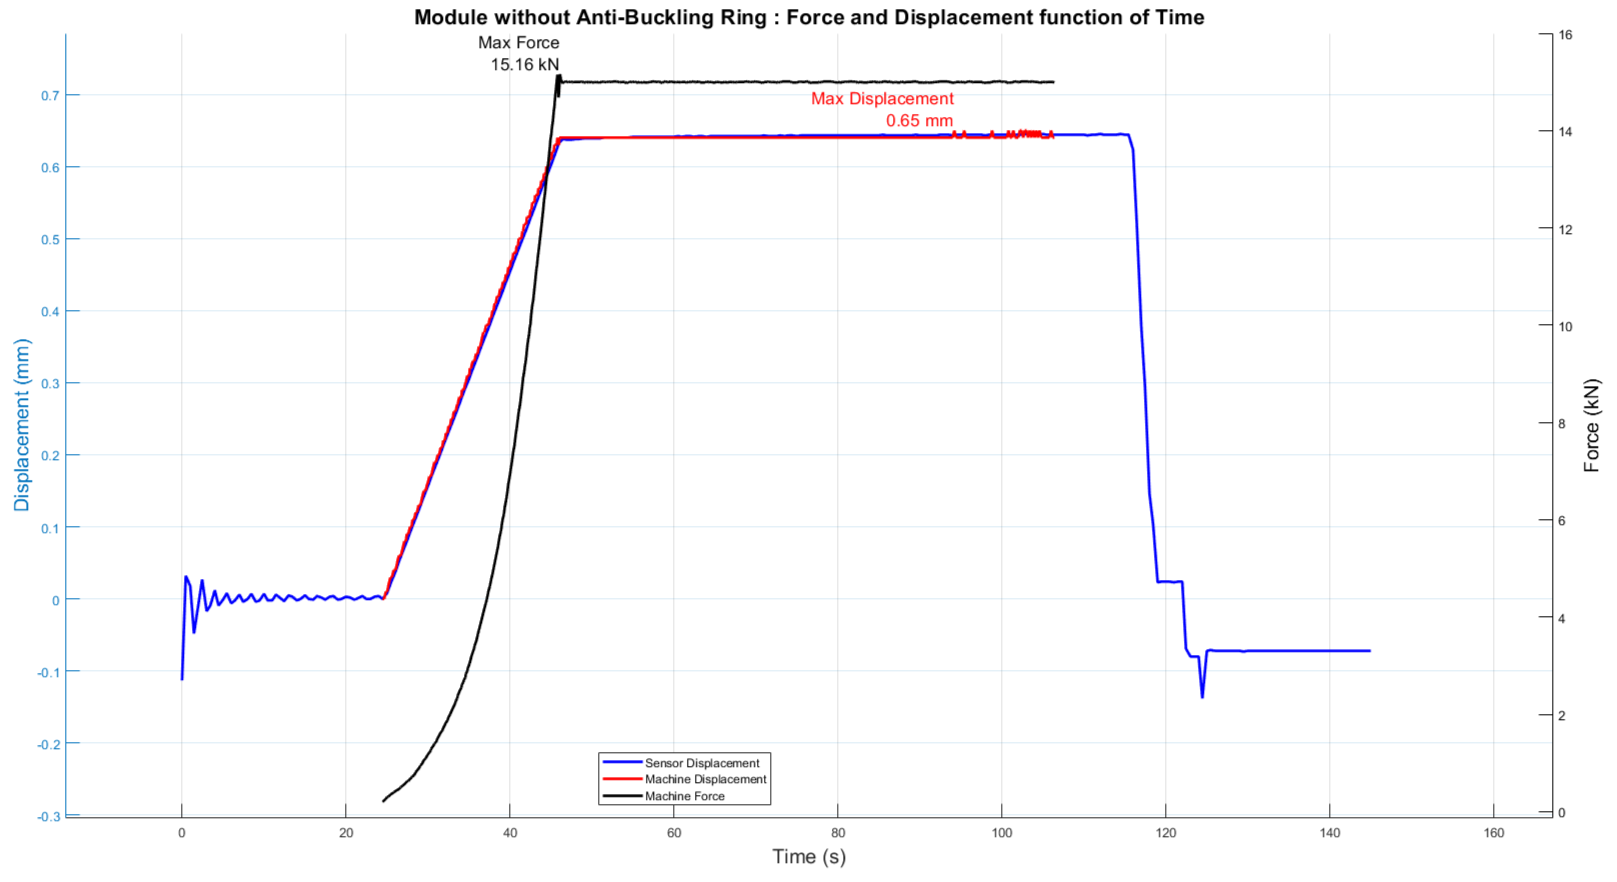
The force equivalent to the flight loads was successfully achieved and maintained. During the 60 seconds of force maintenance, the displacement remained stable.
¶ Pass Fail/Criteria
| Criteria | Pass/Fail ? |
|---|---|
| The module Wisthands a load of 15 [kN] | Pass |
| No ear deformation | Pass |
| No ABR deformation | Pass |
| No crack | Pass |
| All screws are intact | Pass |
| No rods delamination | Pass |
| No visible deformation after load removal | Pass |
The module has successfully passed the test
¶ Data Analysis
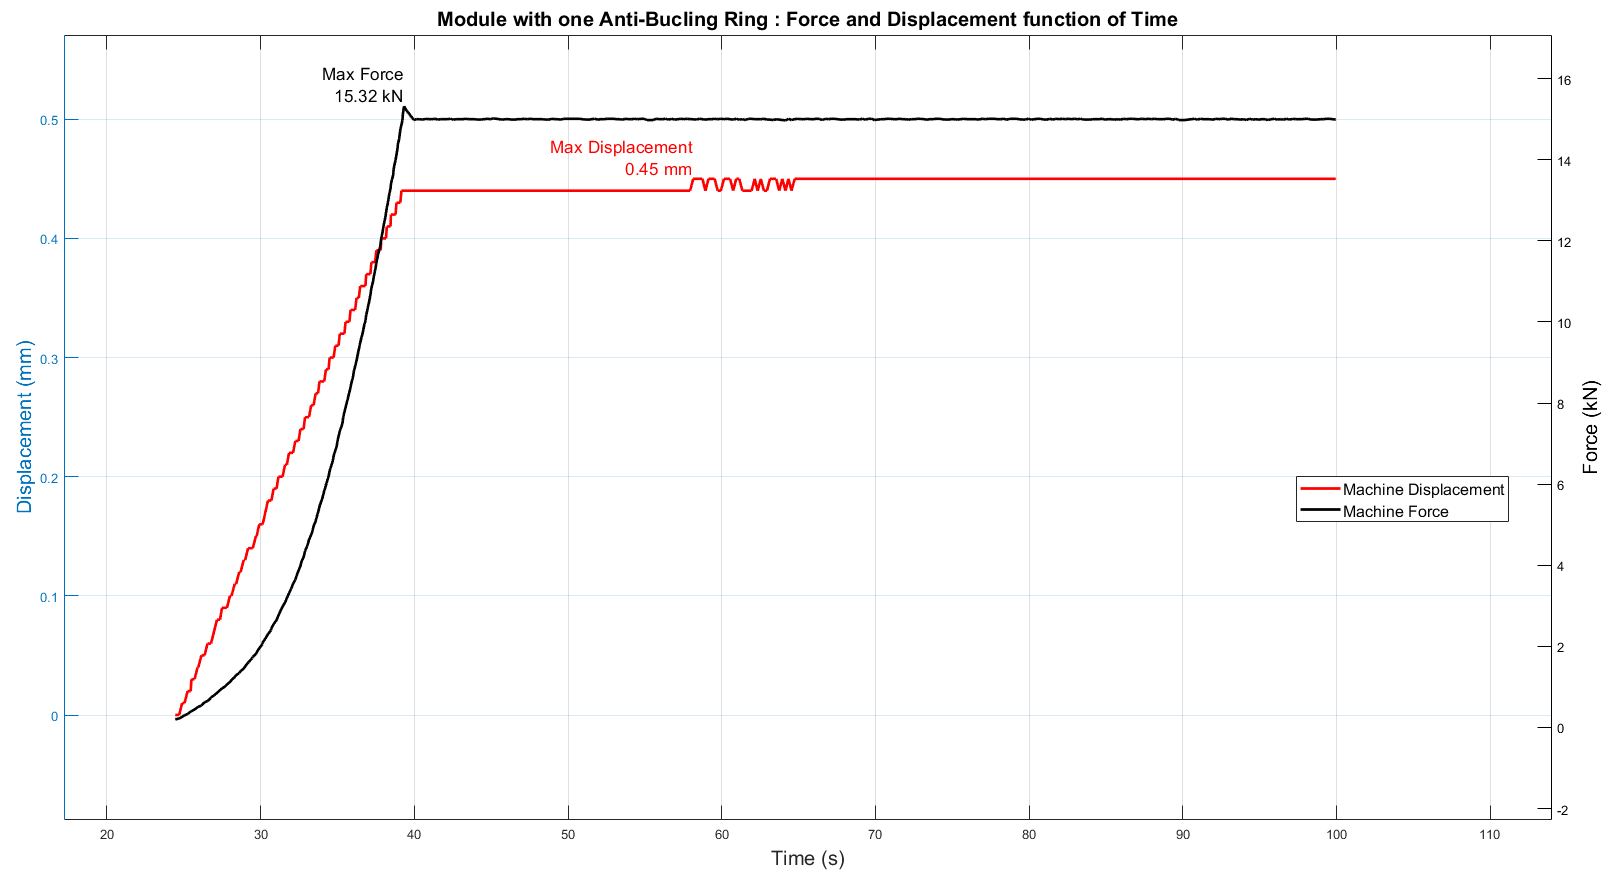
The force equivalent to the flight loads was successfully achieved and maintained. During the 60 seconds of force maintenance, the displacement remained stable.
¶ Pass Fail/Criteria
| Criteria | Pass/Fail ? |
|---|---|
| The module Wisthands a load of 15 [kN] | Pass |
| No ear deformation | Pass |
| No ABR deformation | Pass |
| No crack | Pass |
| All screws are intact | Pass |
| No rods delamination | Pass |
| No visible deformation after load removal | Pass |
The module has successfully passed the test
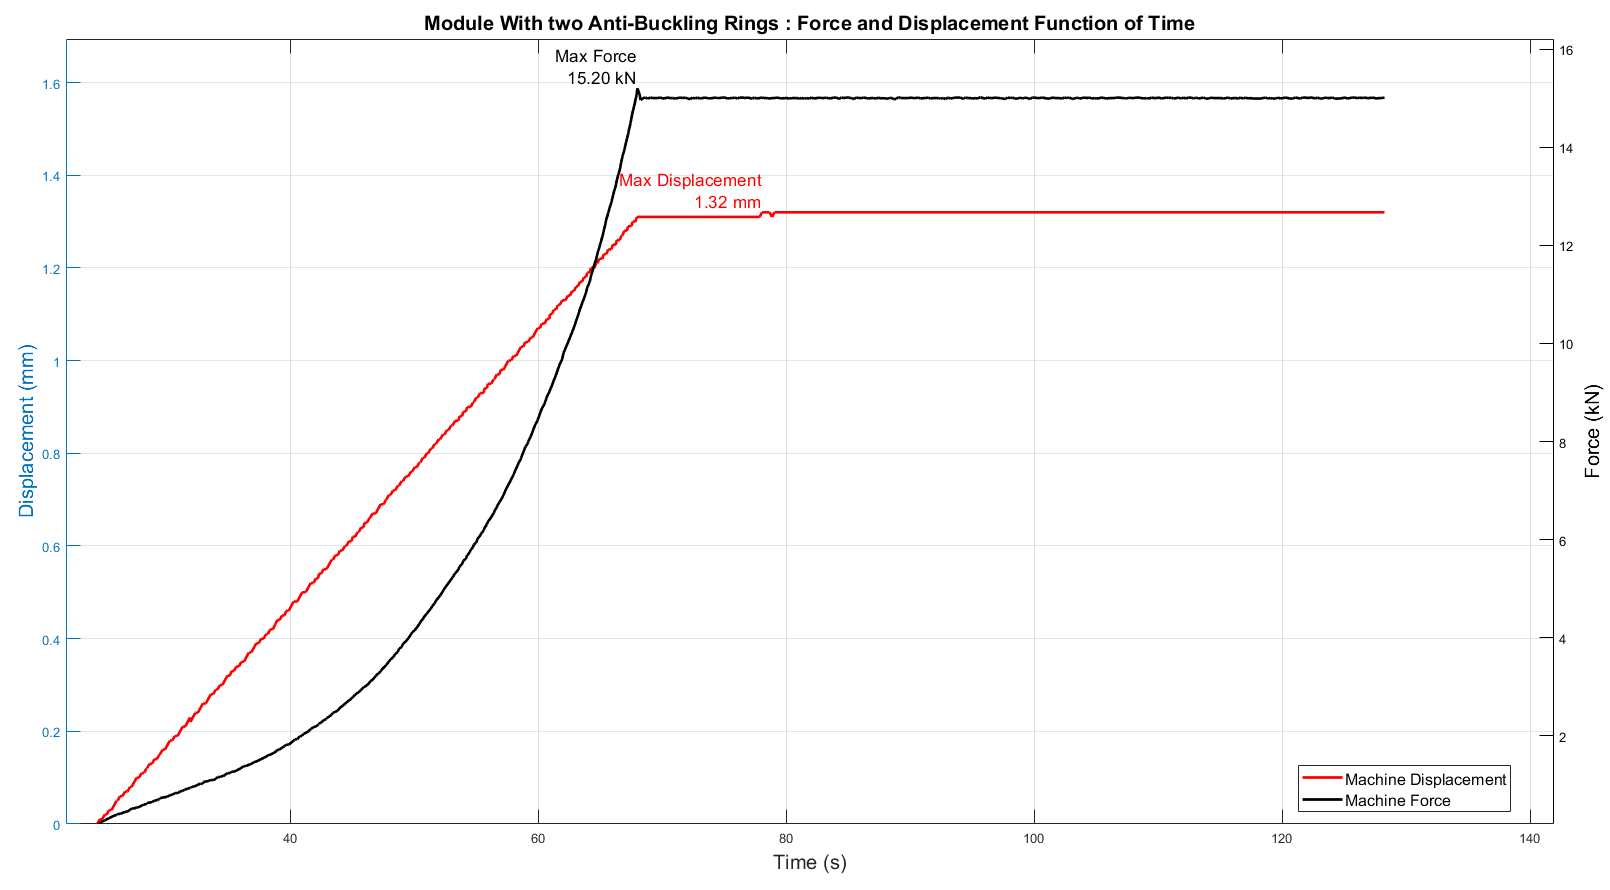
¶ Qualification Test
Load : Until the module break
Time : Unlimited
Goal : Determine the structure's limits and compare the results with the simulations
¶ Data Analysis
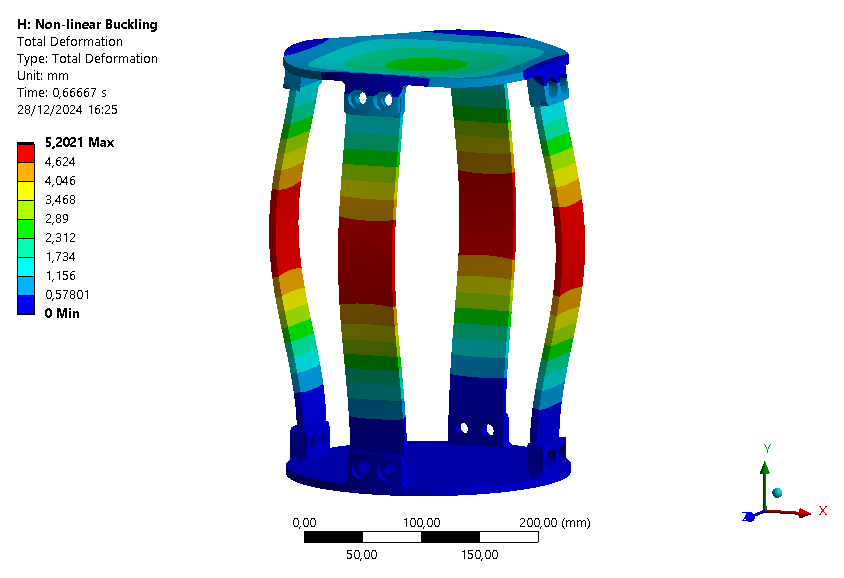
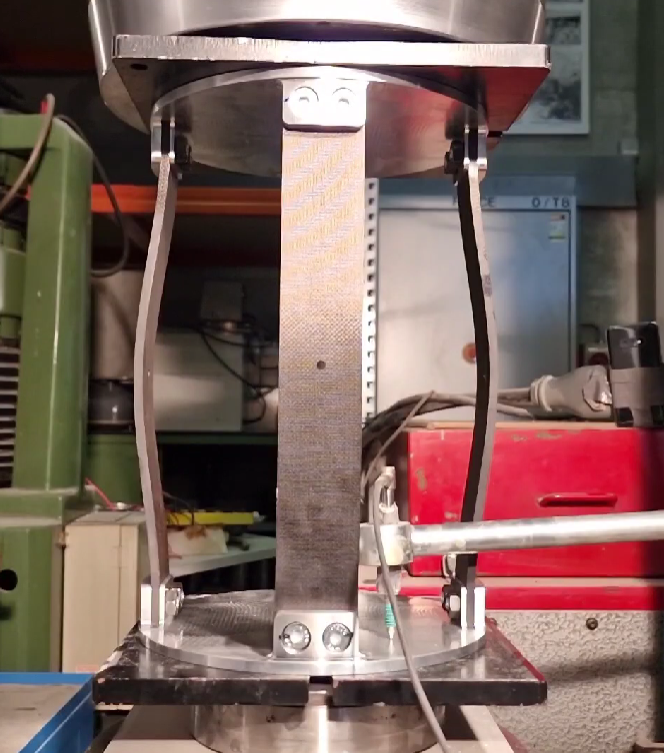
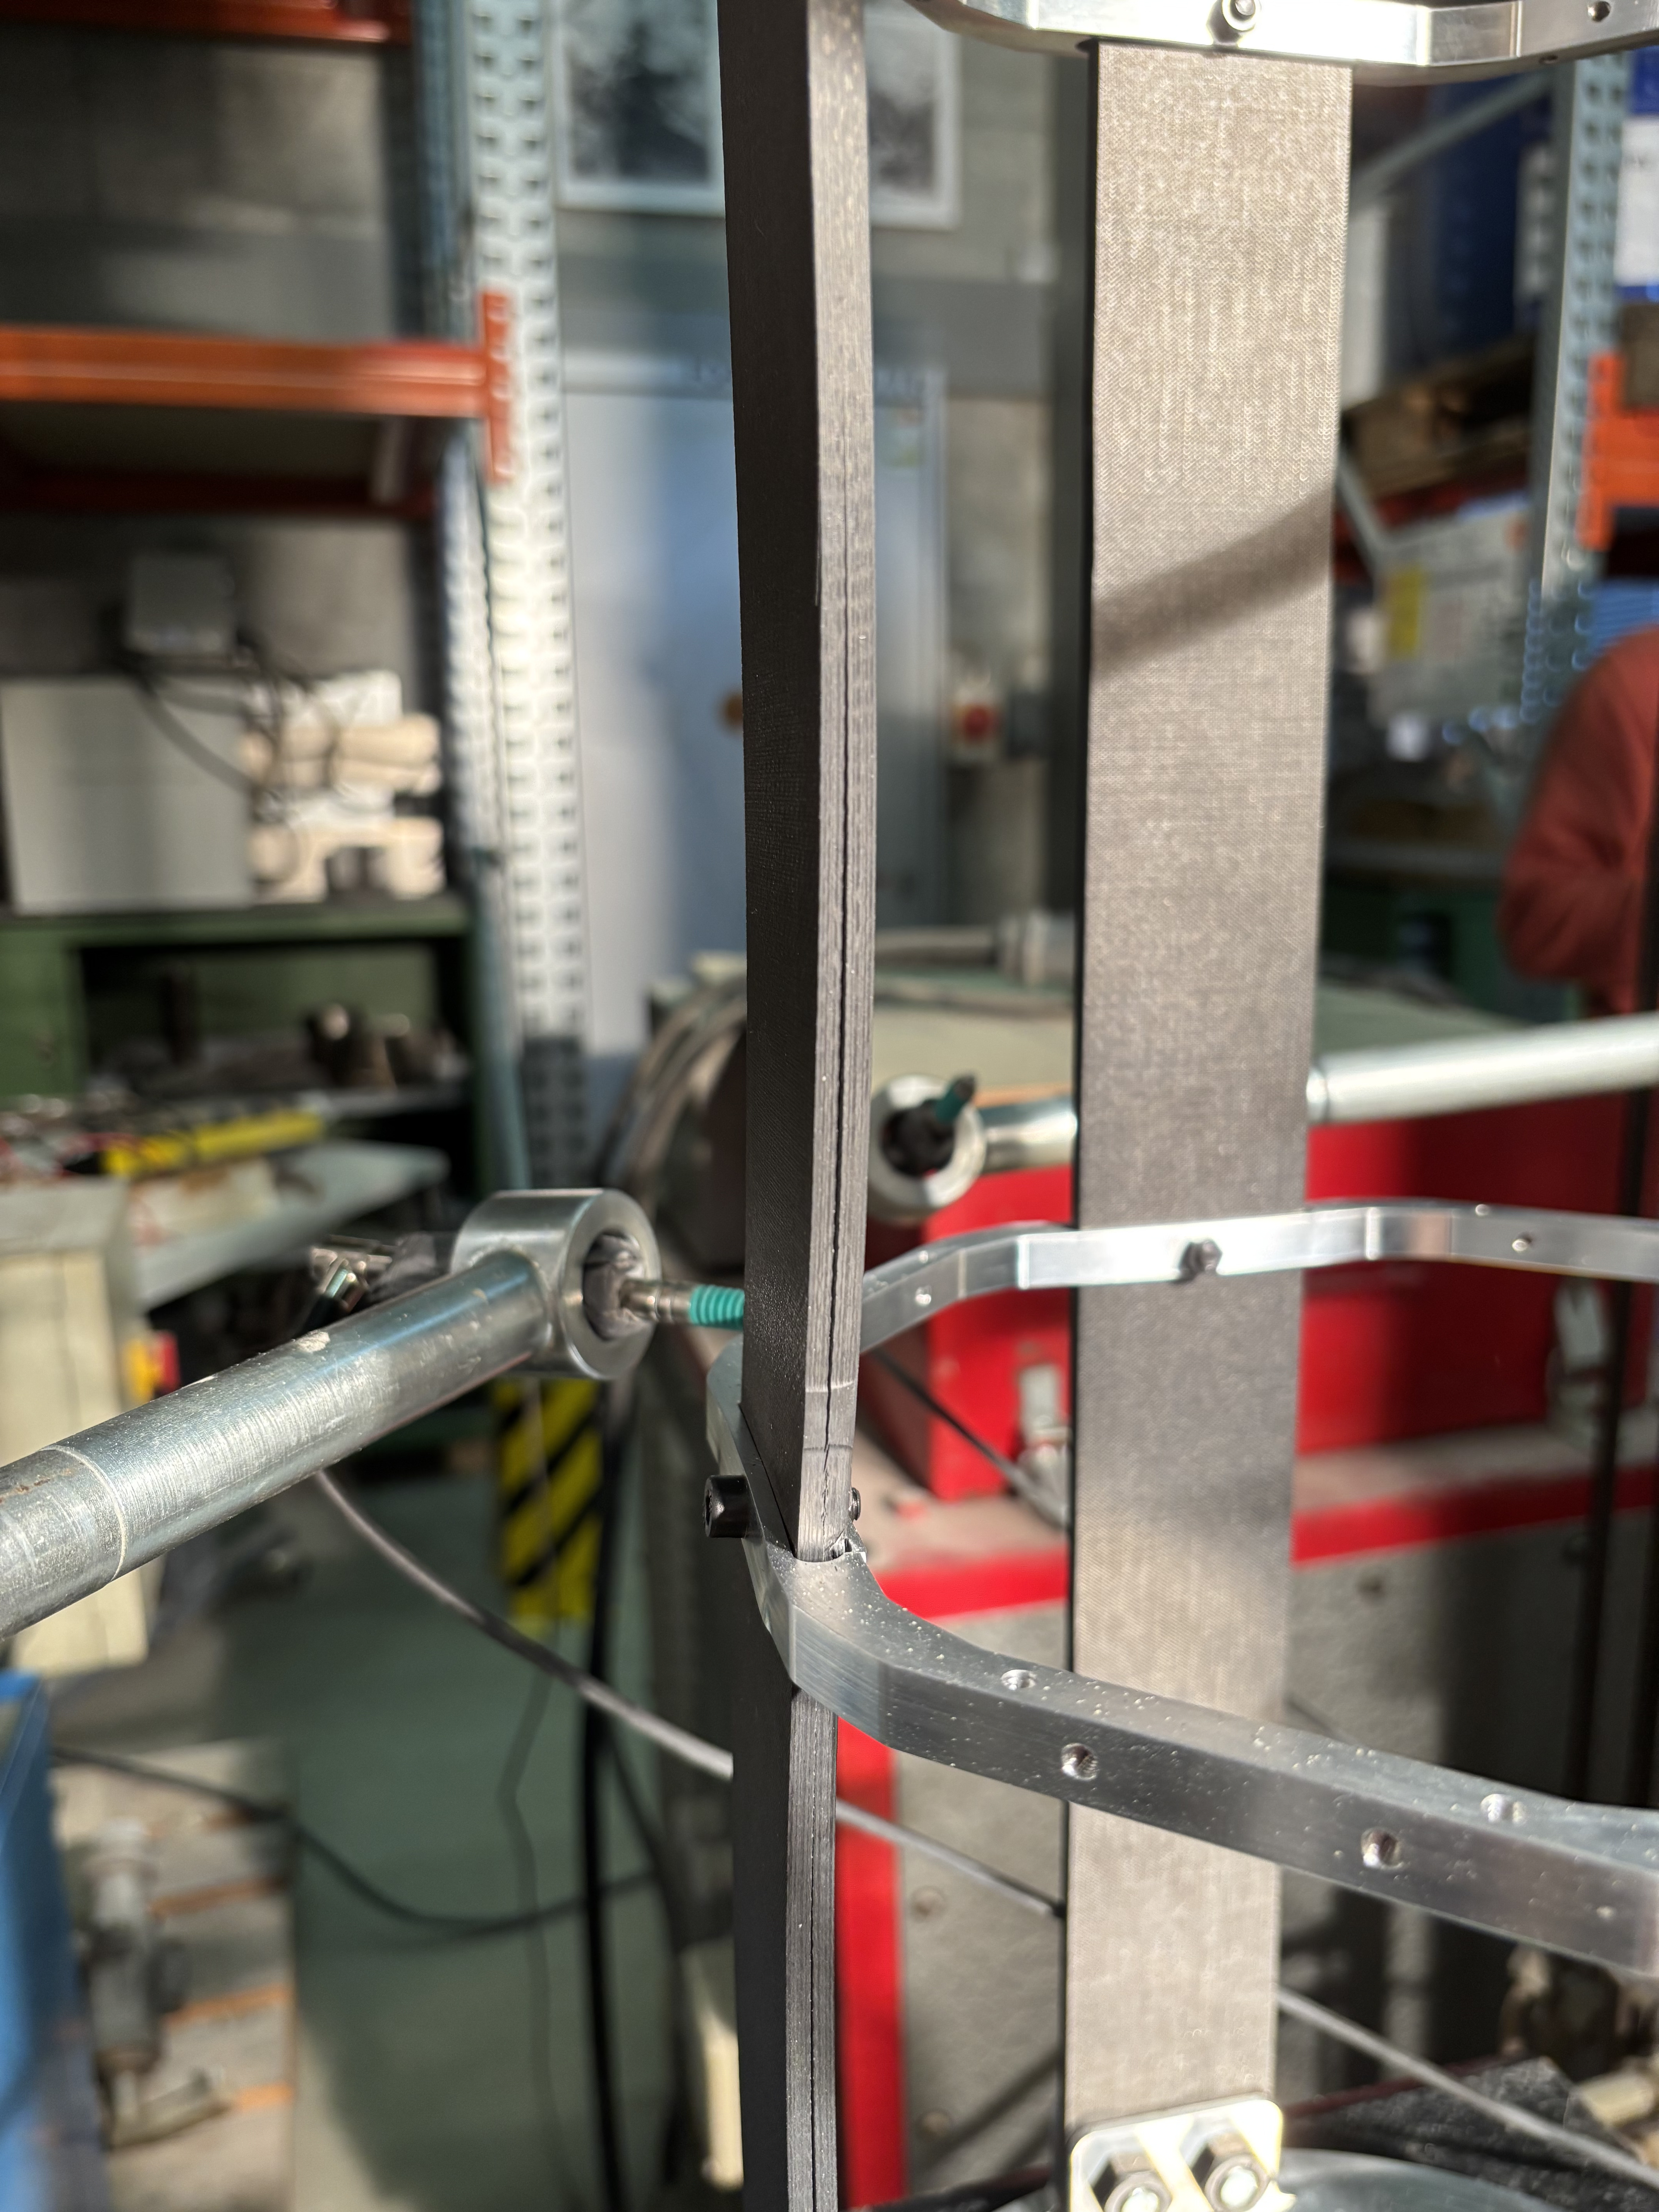
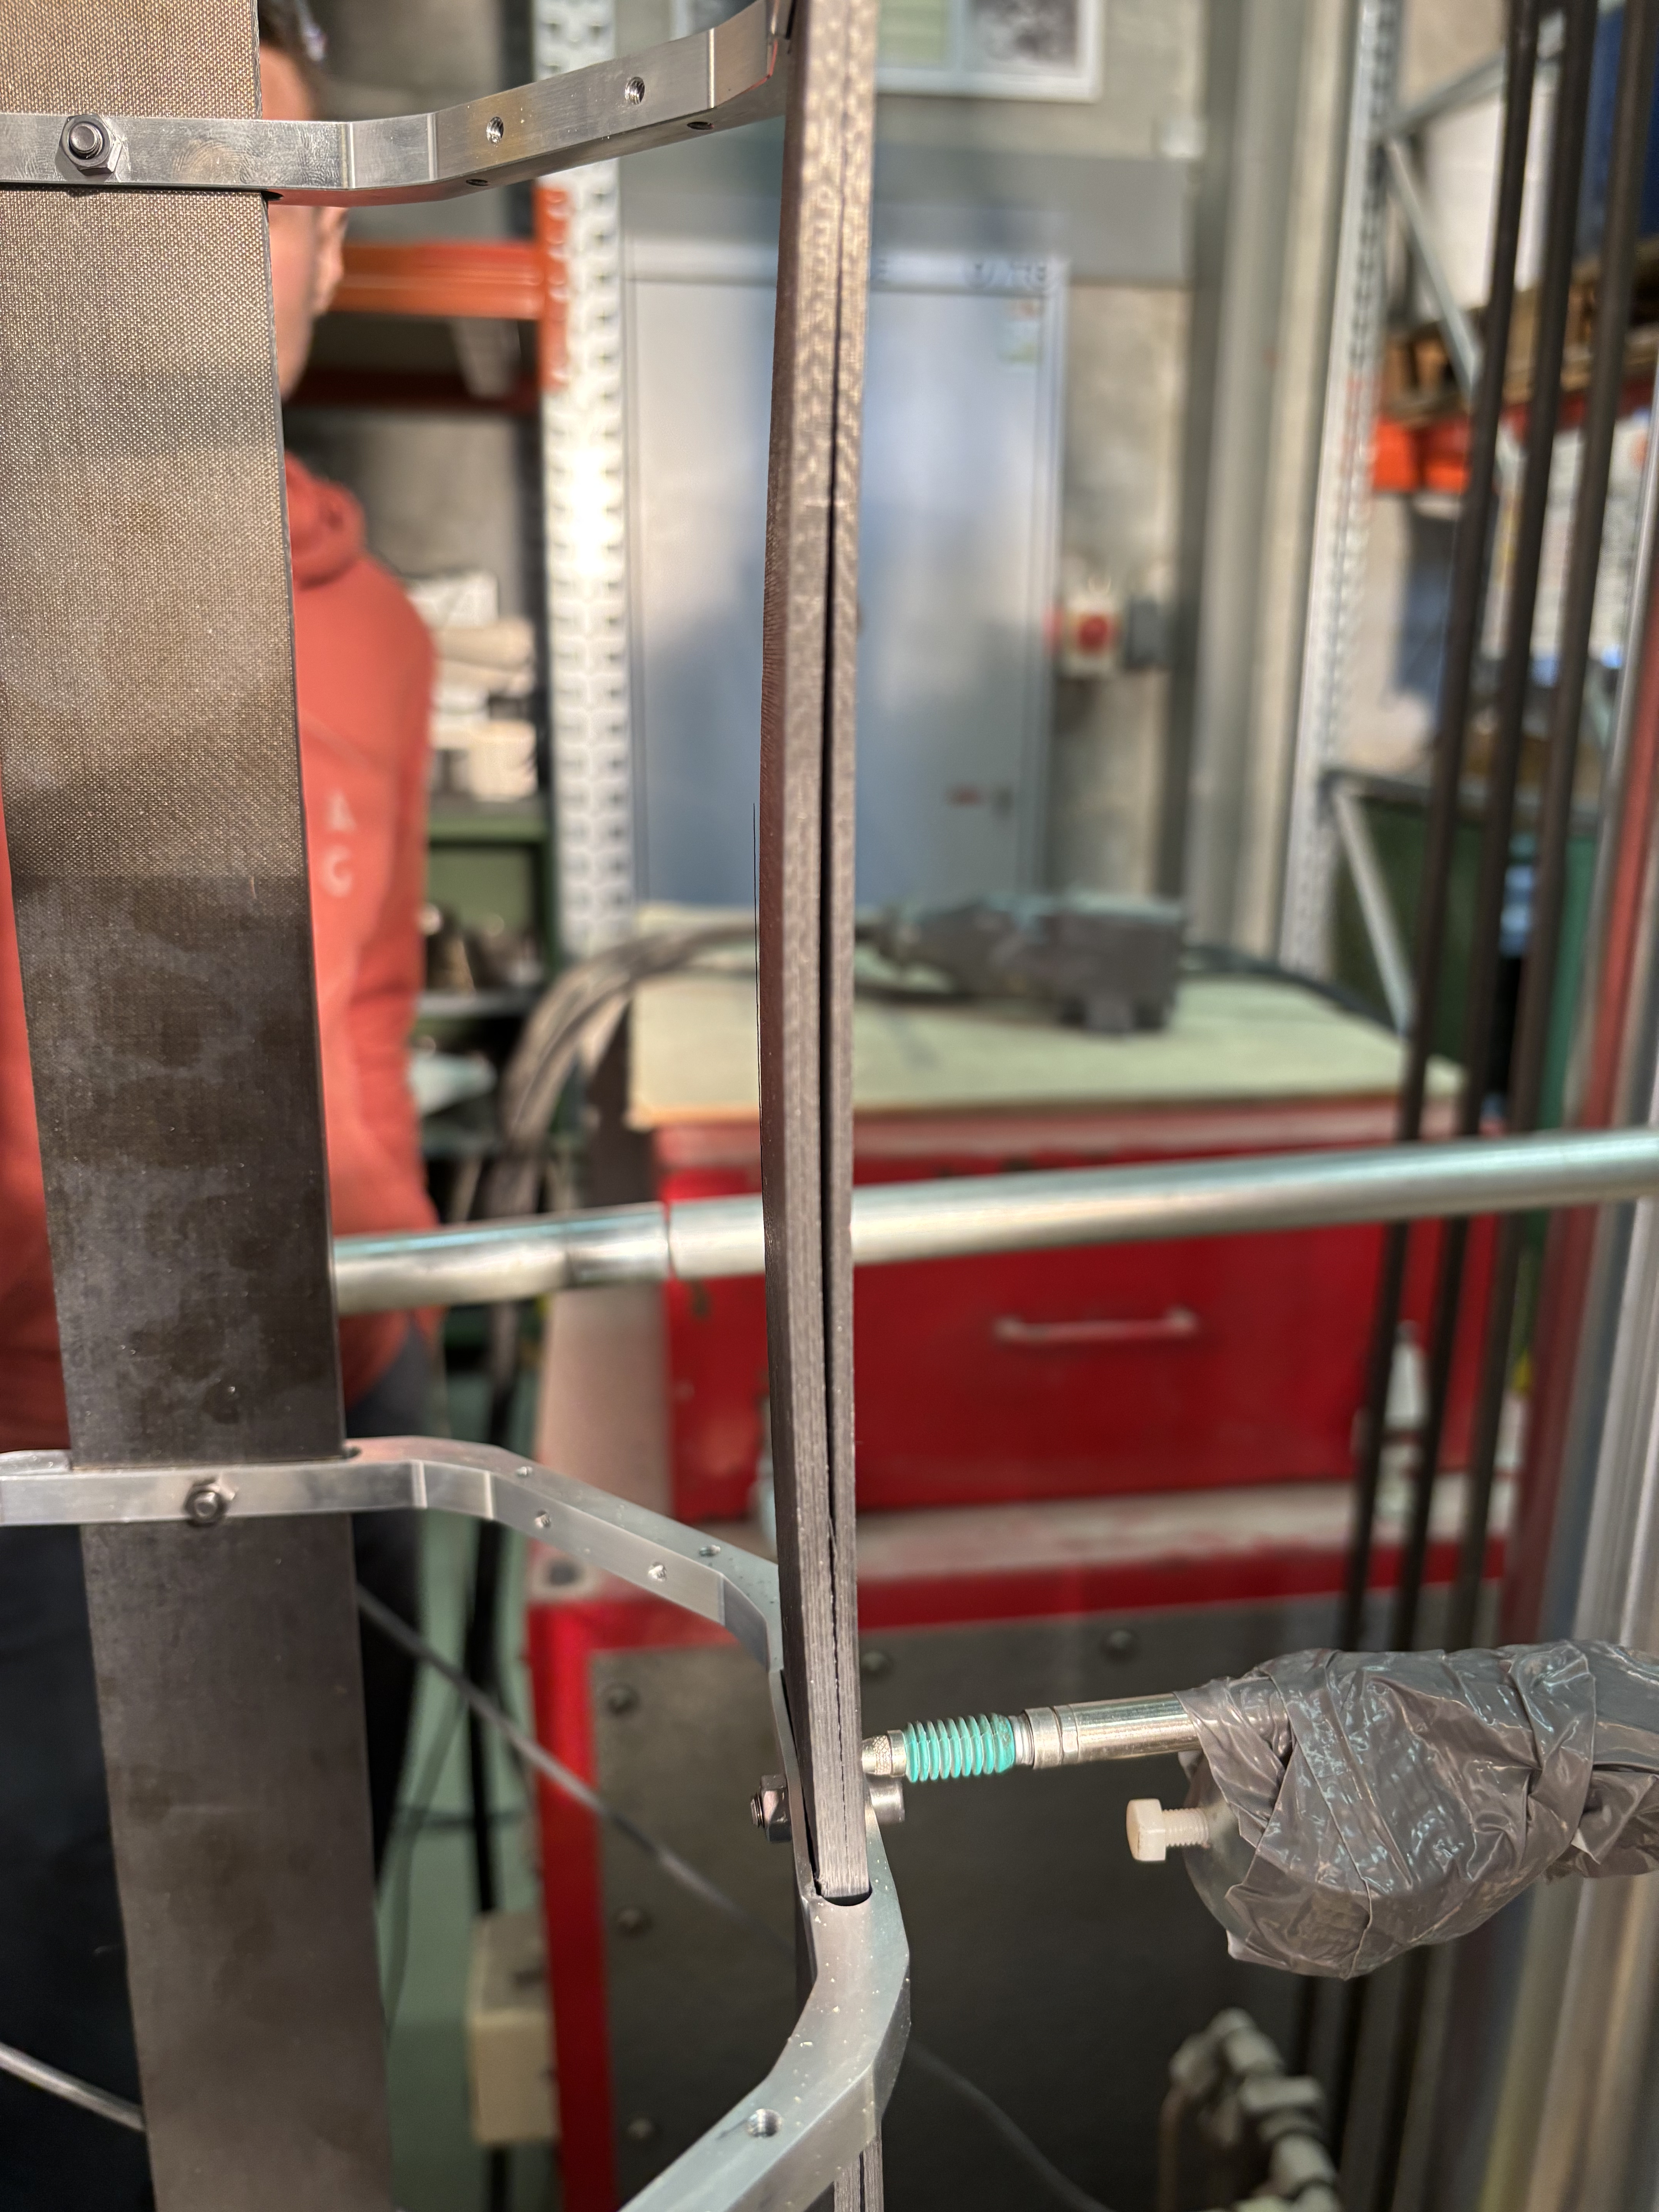
The non-linear buckling simulation gave a result such that the module deformed in the first mode with all rods going outwards. As shown in the figure below, the module did indeed deform as shown by the simulation.
| |
| |
| |
|
| First buckling mode | Non-linear buckling simulation | Module under load |
|---|
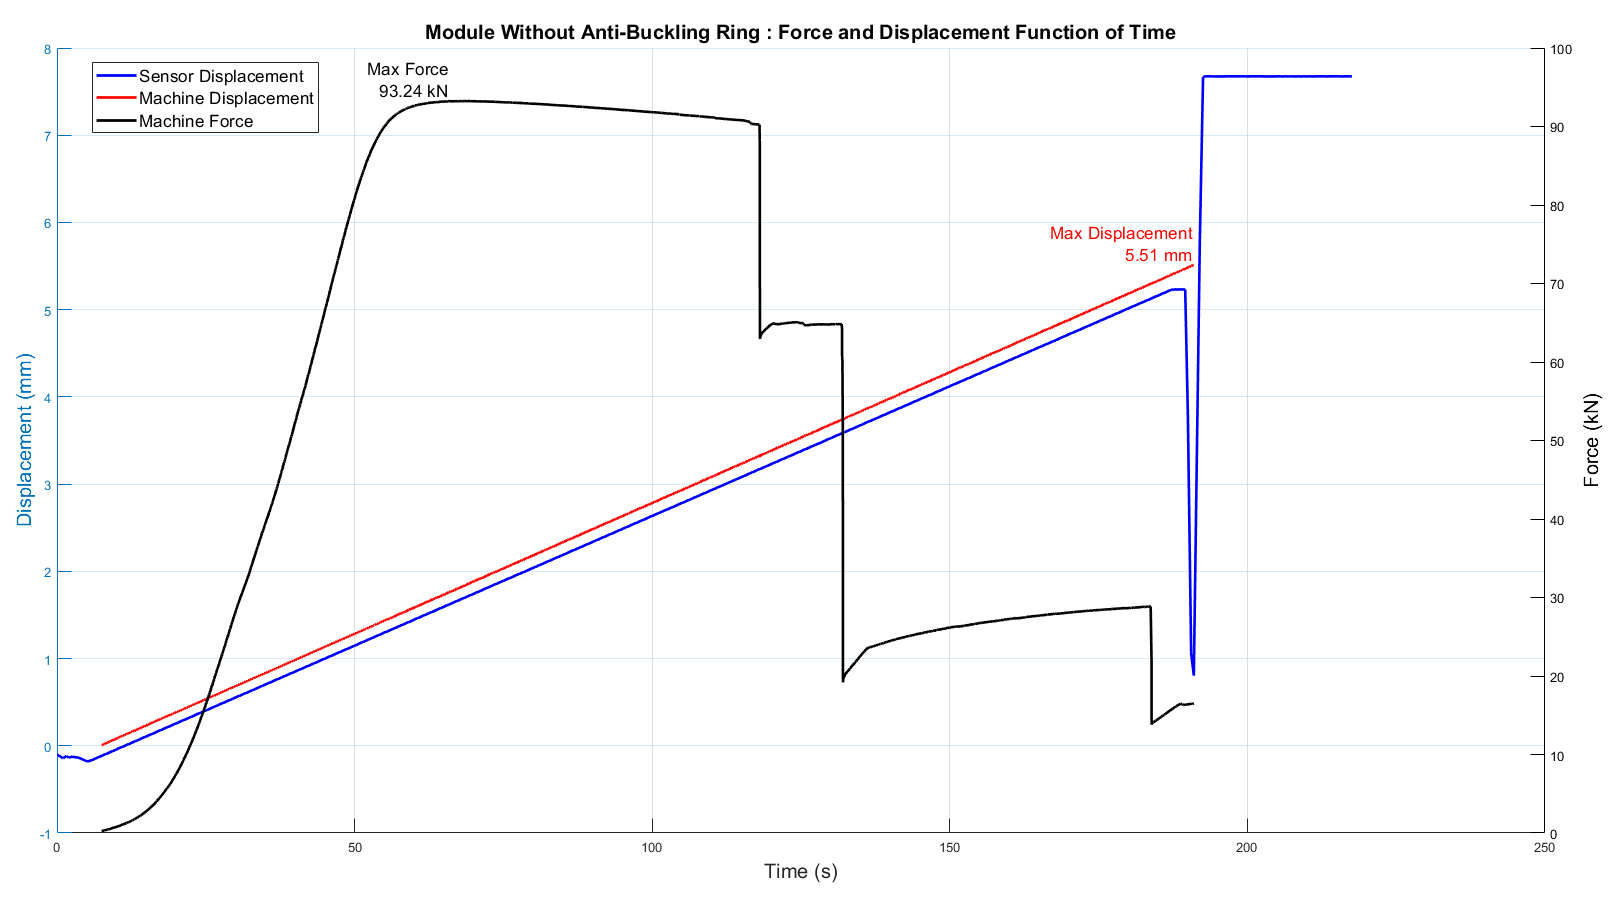
The force reached the maximum value of 93.24 [kN], which is the value at which the module began to buckle. The machine displacement at the maximal force is 1.76 [mm] and the maximal machine displacement is 5.51 [mm]. The first drop in force between 93 [kN] and 64 [kN] corresponds to the fracture and delamination of the right-hand rod. The second drop in force between 64 [kN] and 25 [kN] corresponds to the fracture of the rear rod. The final force drop between 25 [kN] and 16 [kN] corresponds to a second delamination of the right-hand rod.
Non-linear buckling simulation result : 86.75 [kN]
Test Results : 93.24 [kN]
Error : 6.7%
Safety factor on flight load (15 [kN]) : 5.78
Displacement at the maximal force : 1.76 [mm]
The module behaved in accordance with our expectation of flaming in mode 1, with an error of 6.7% on the simulated values. The achieved force of 93.24 [kN] gives us a factor of 5.78 on flight loads.
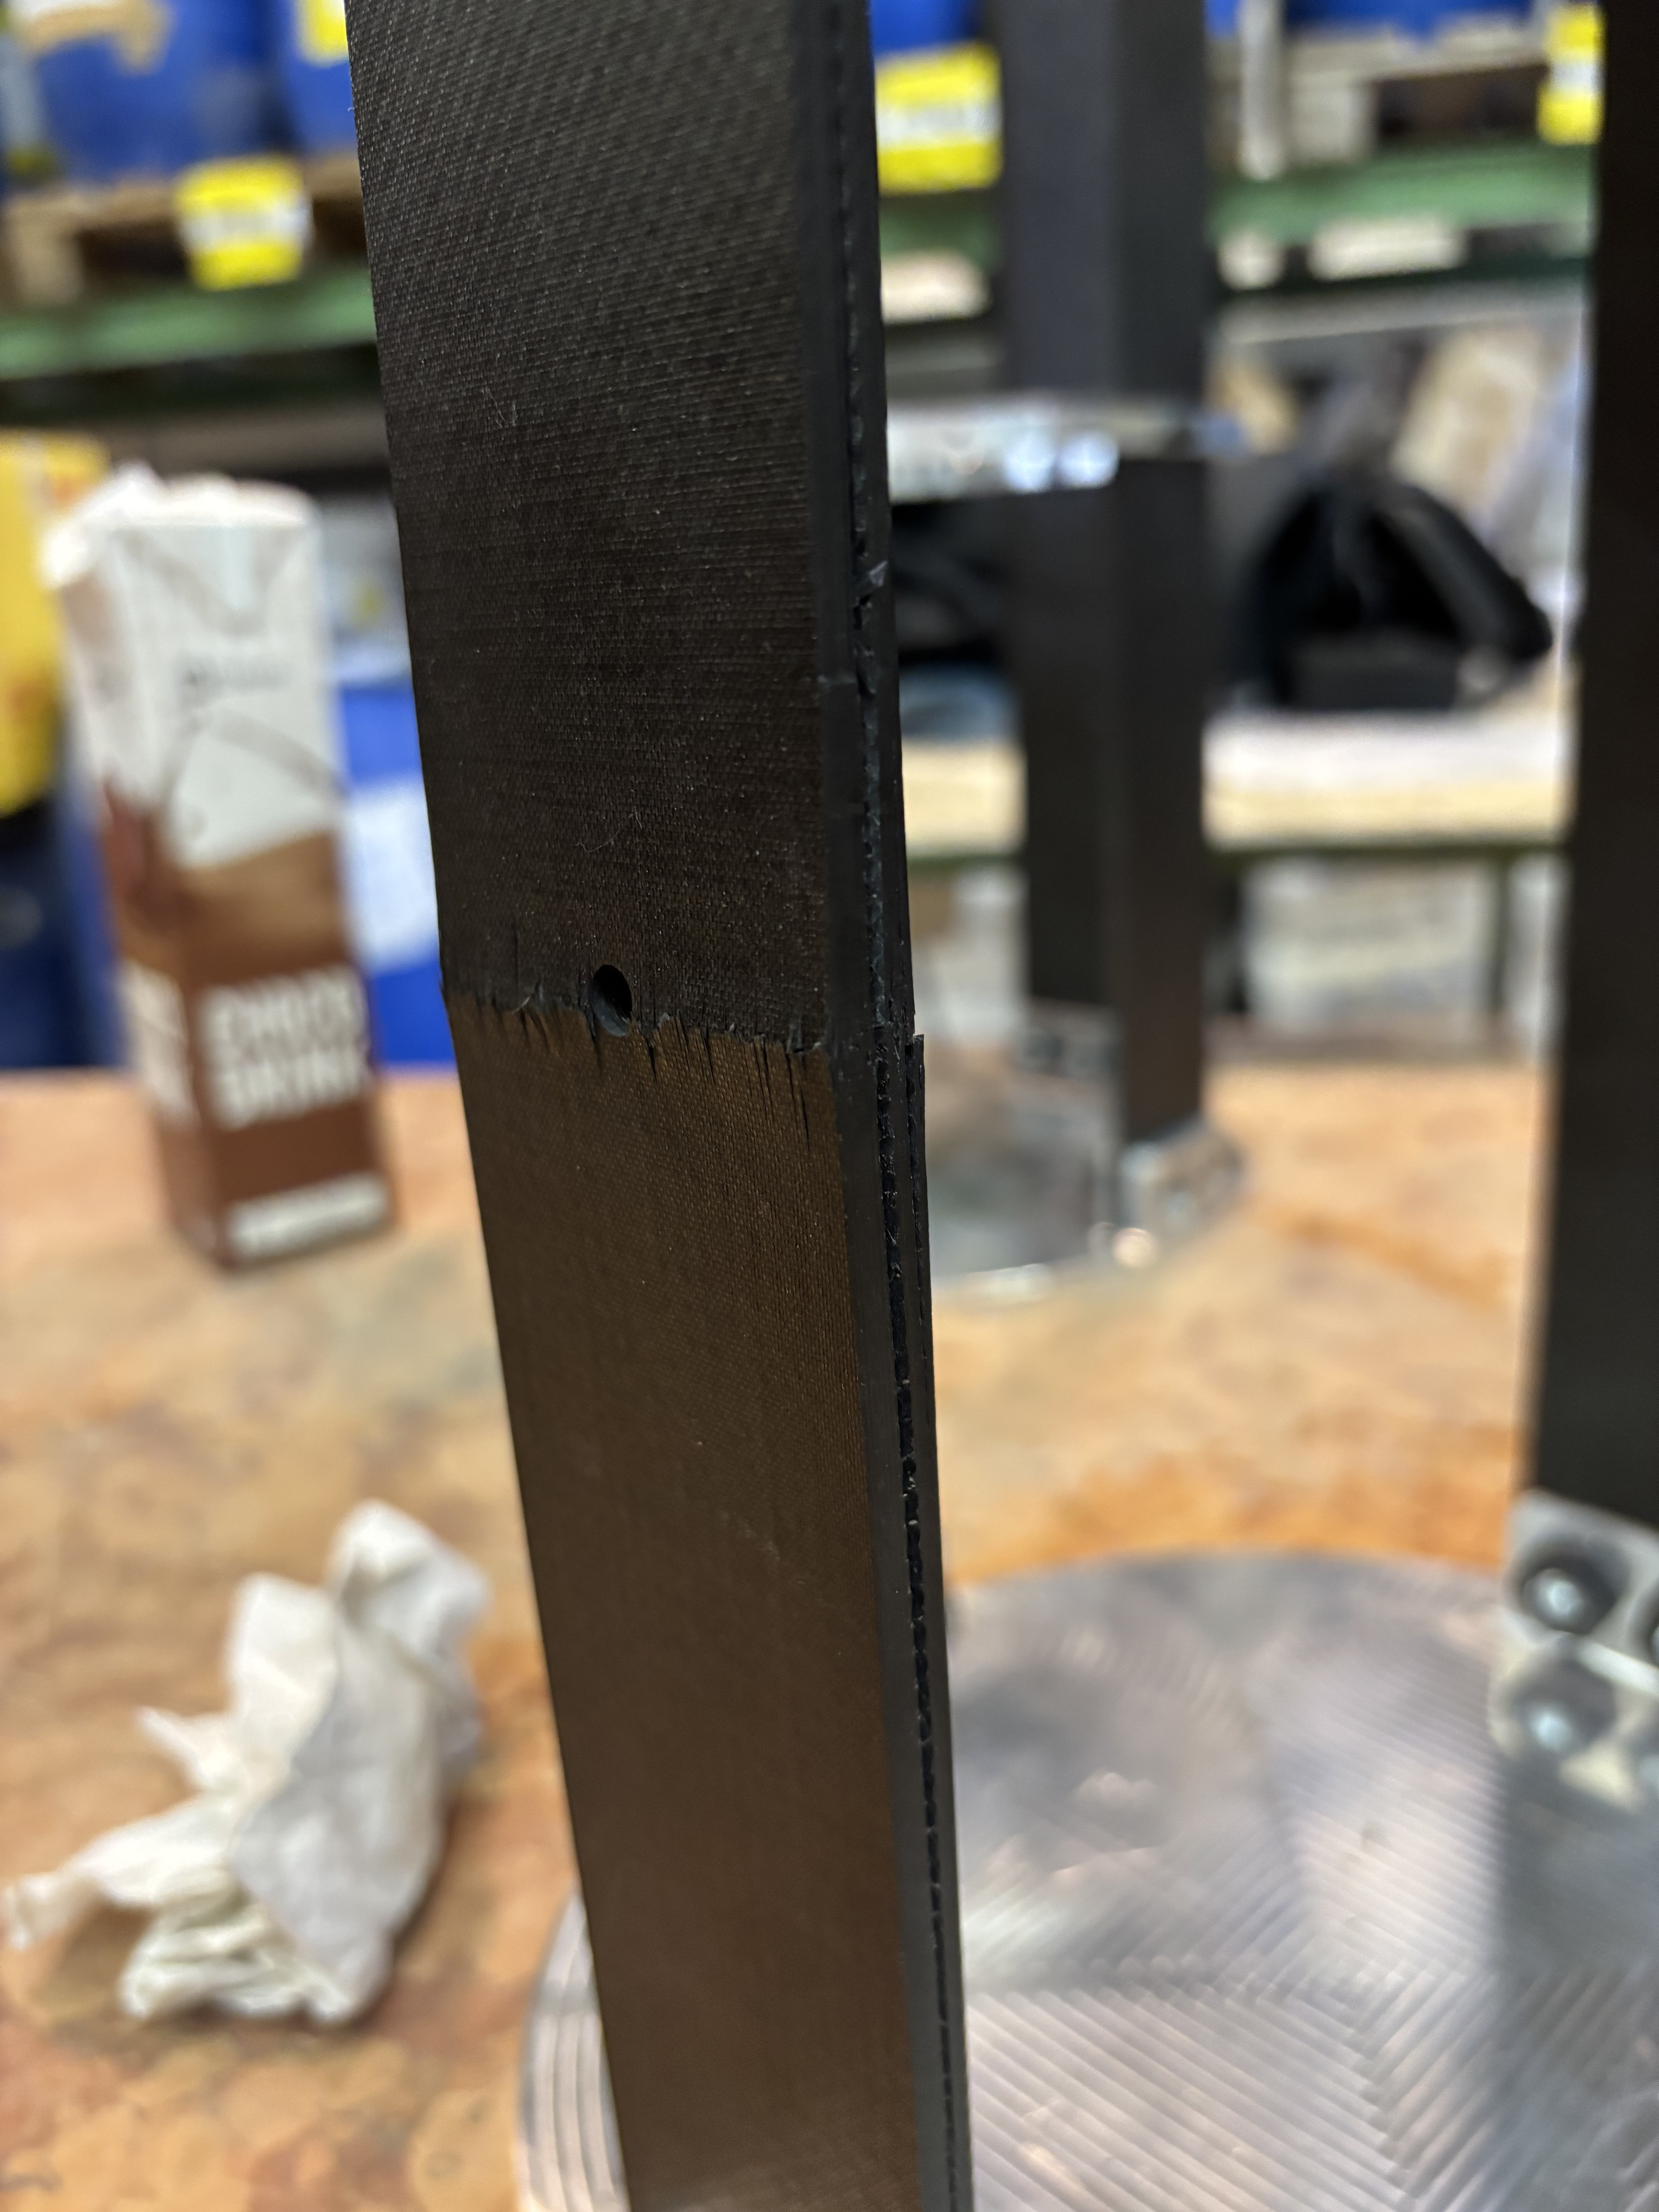
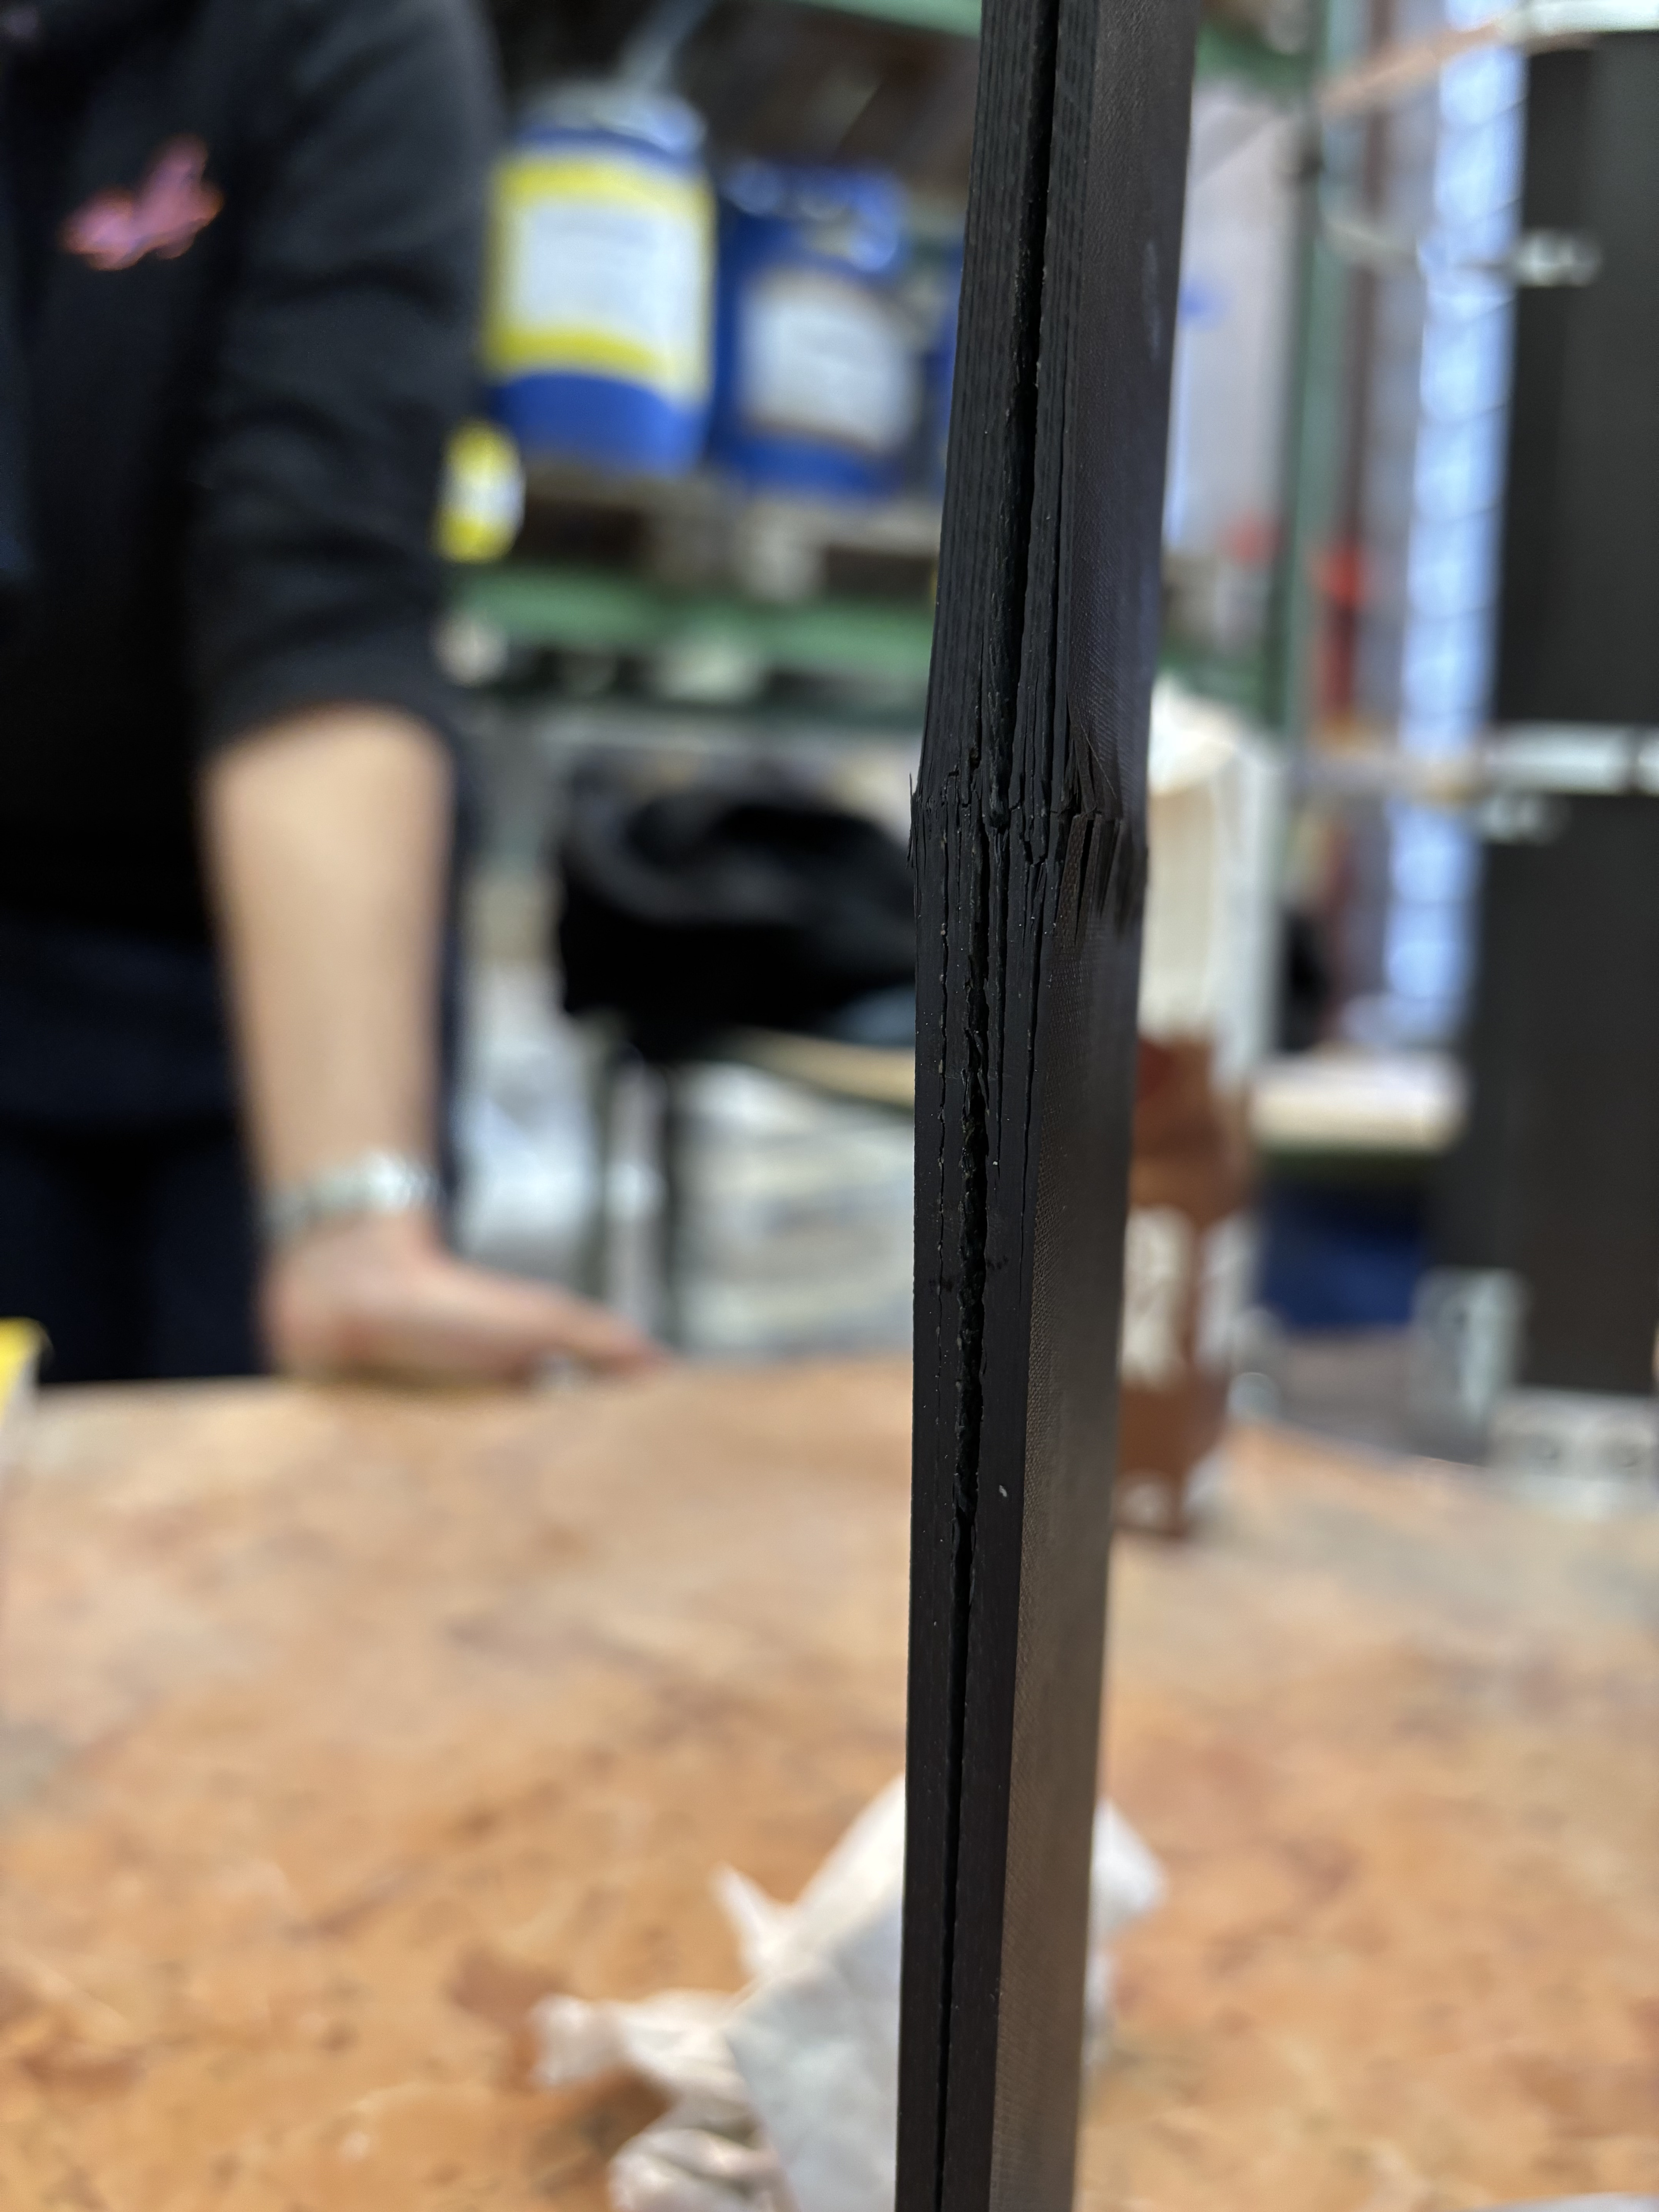
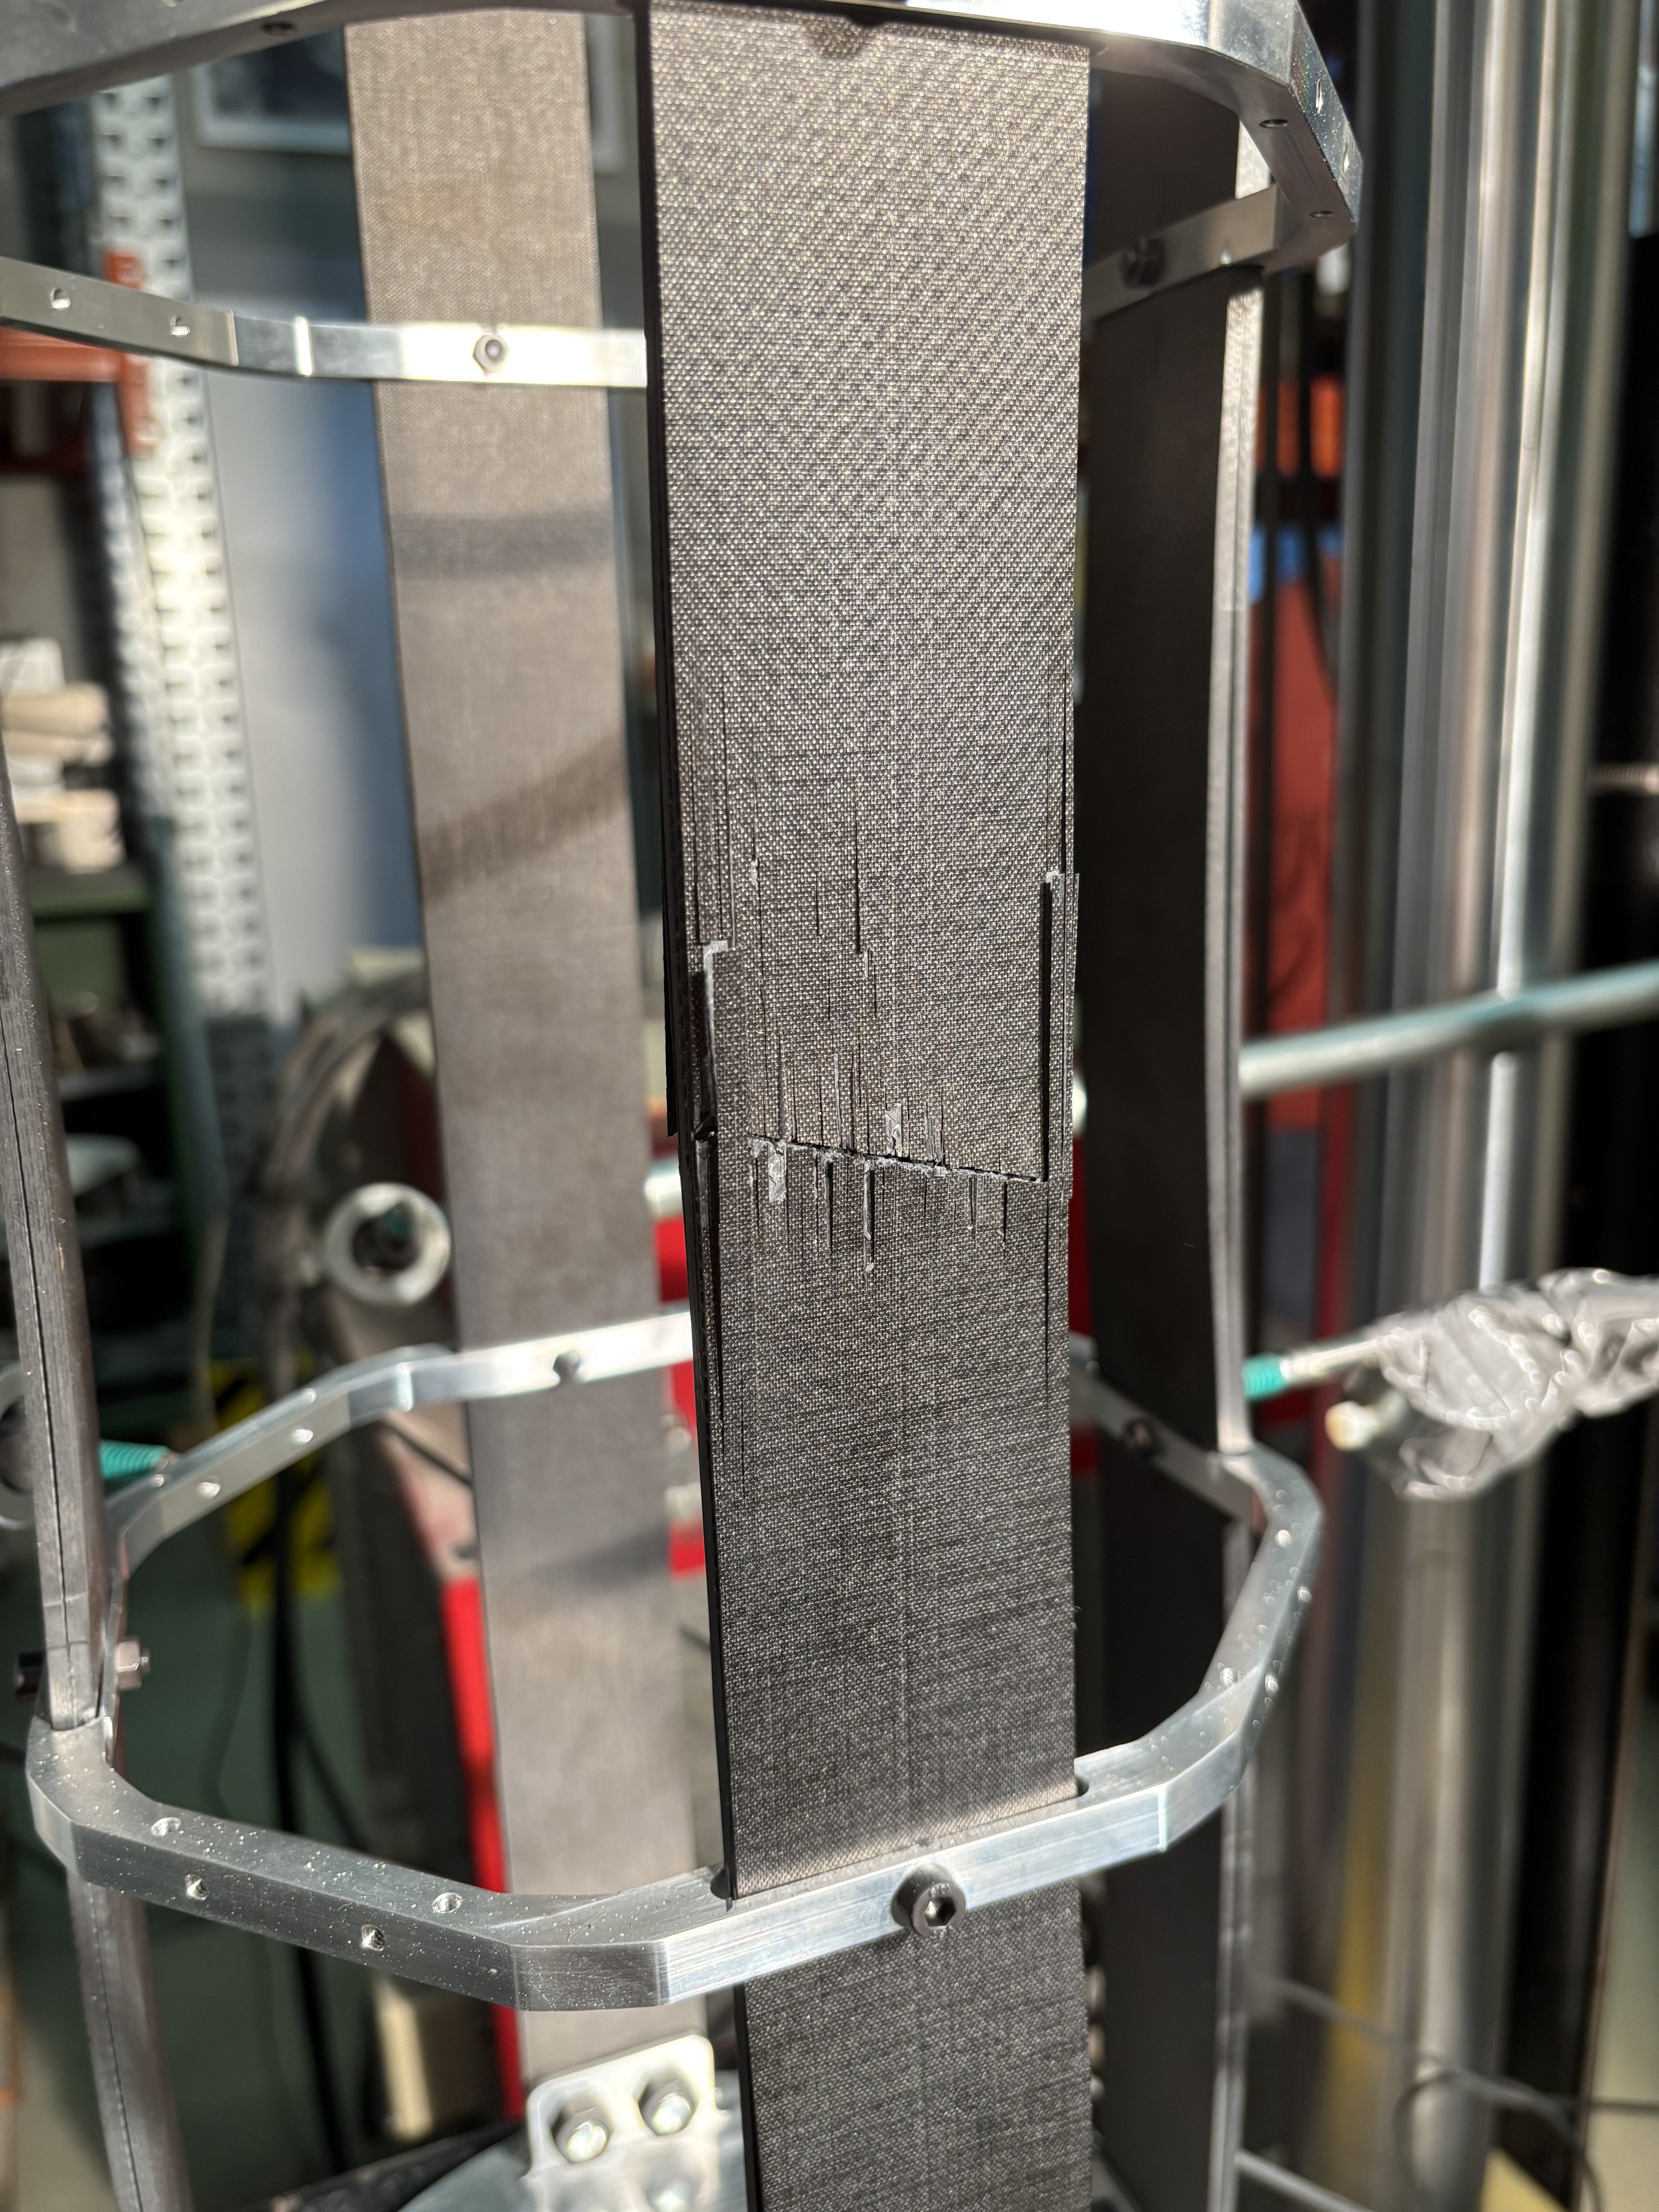
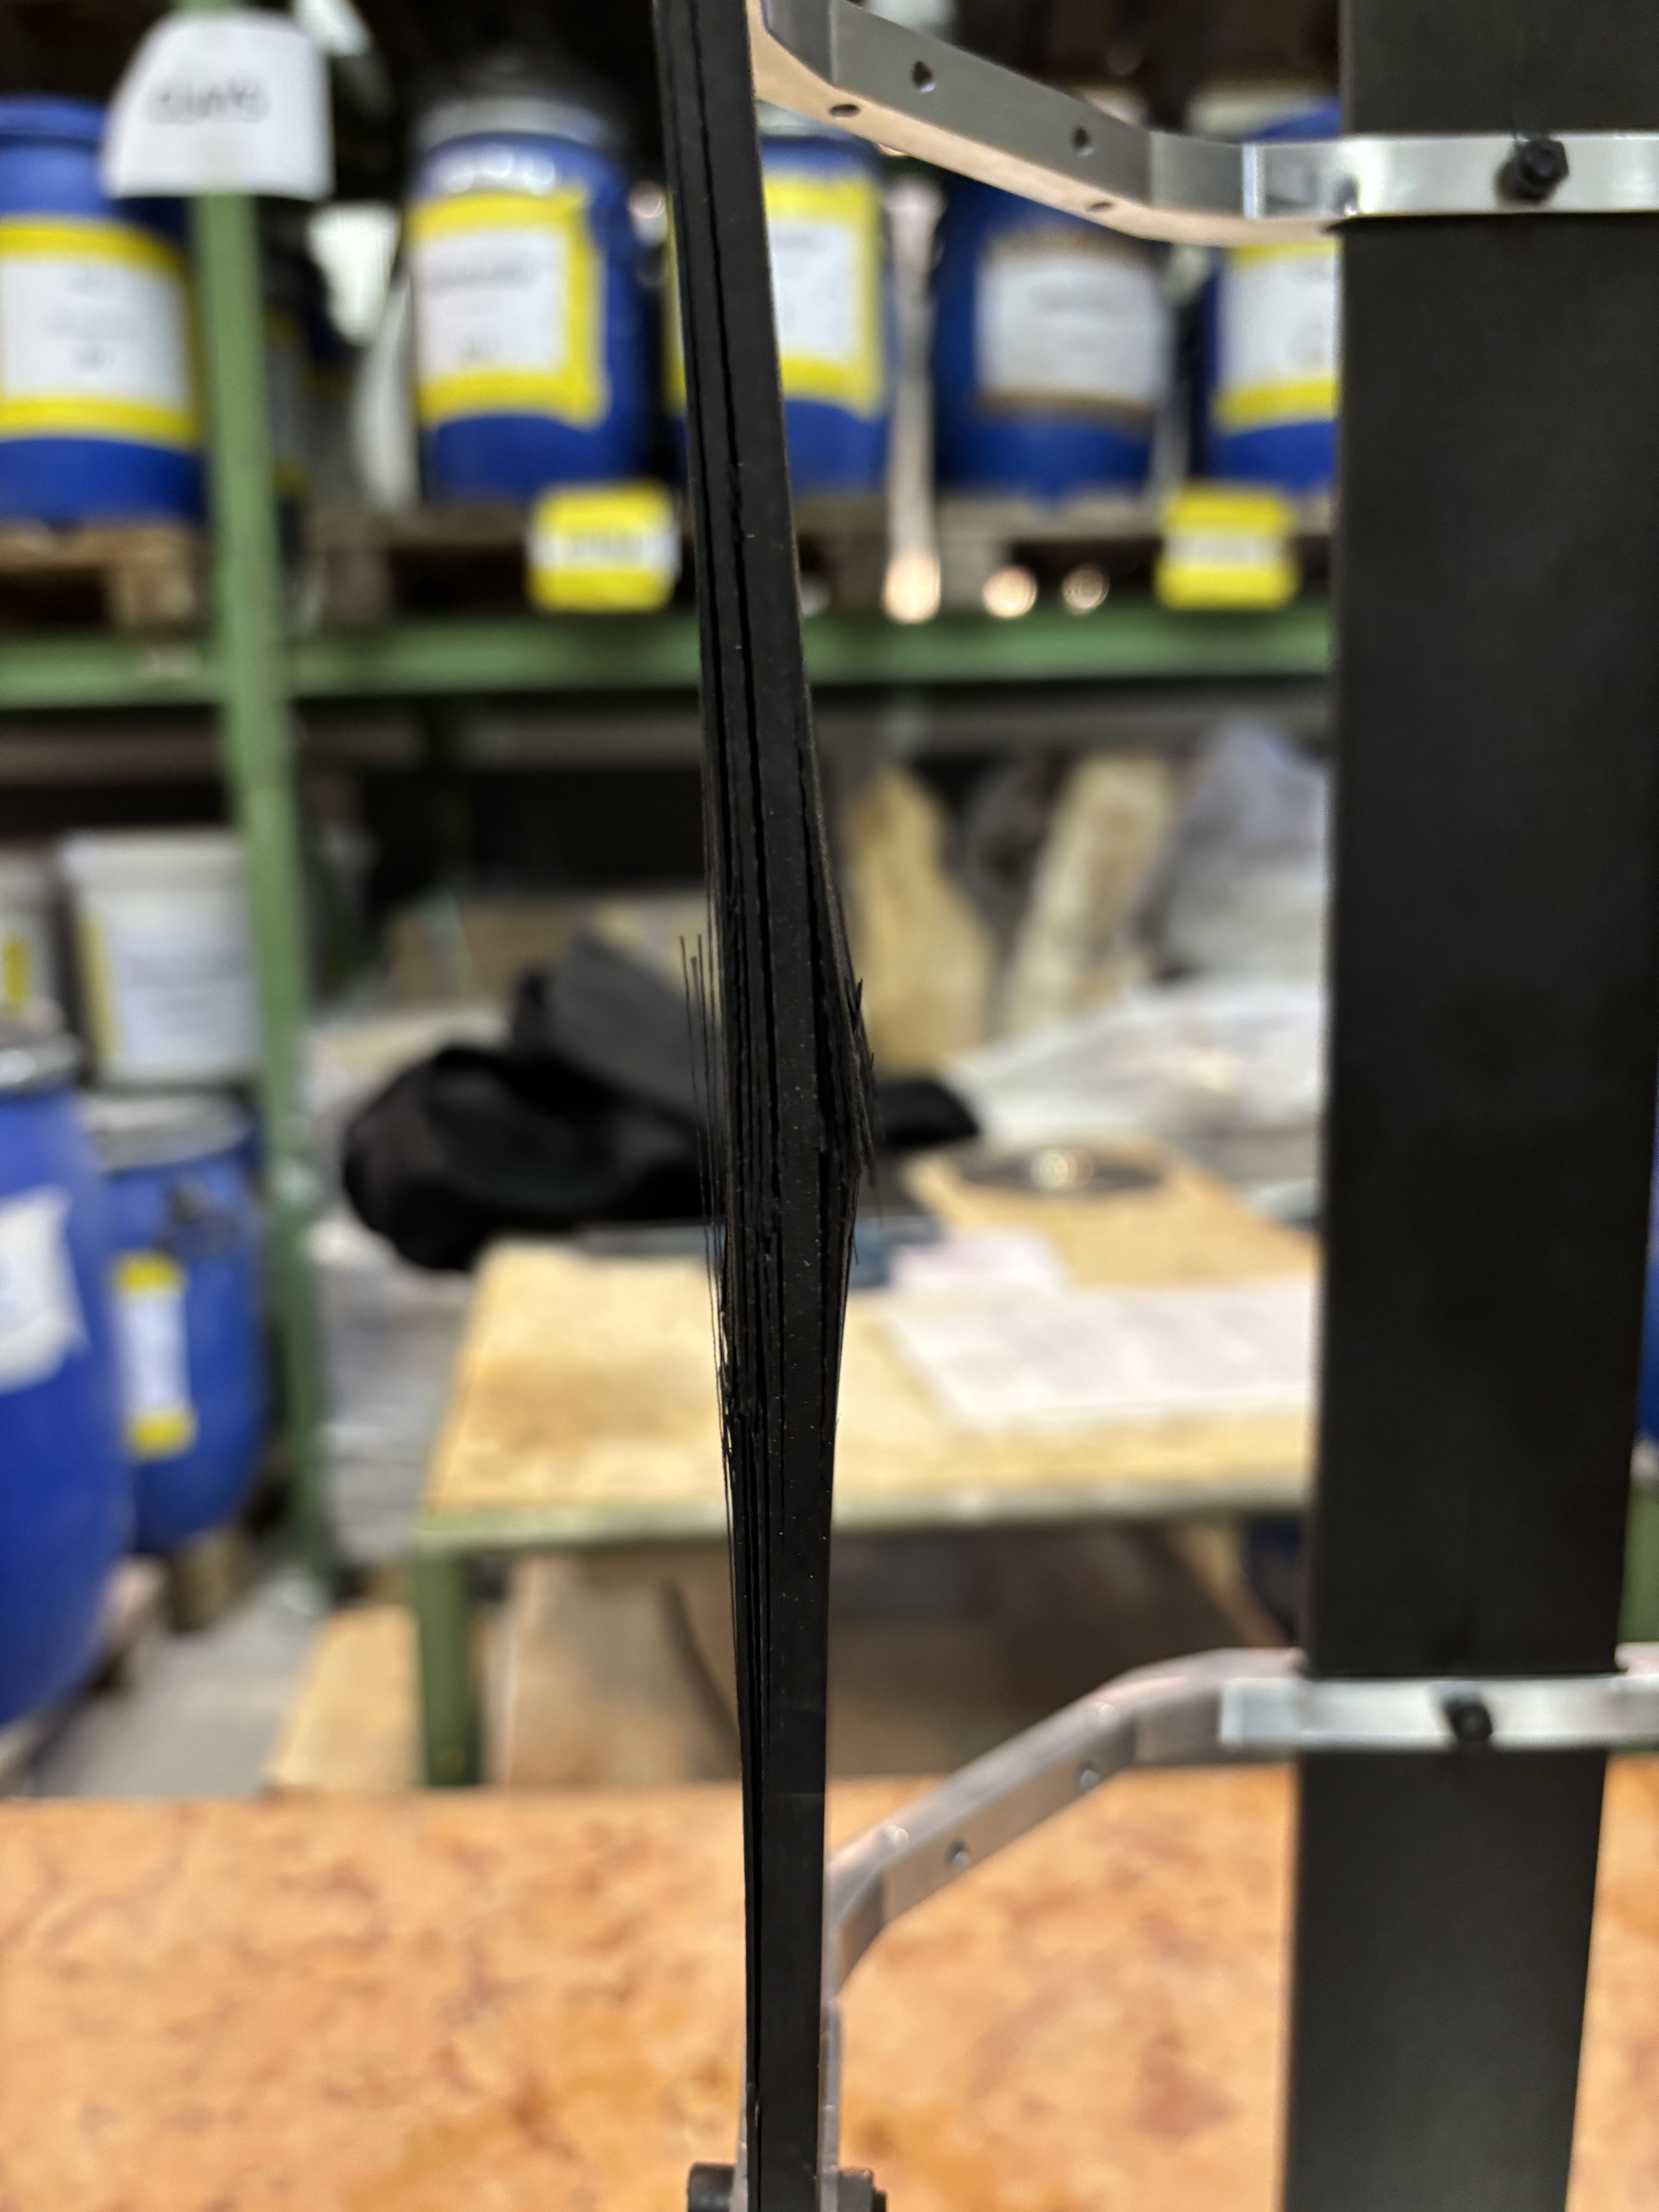
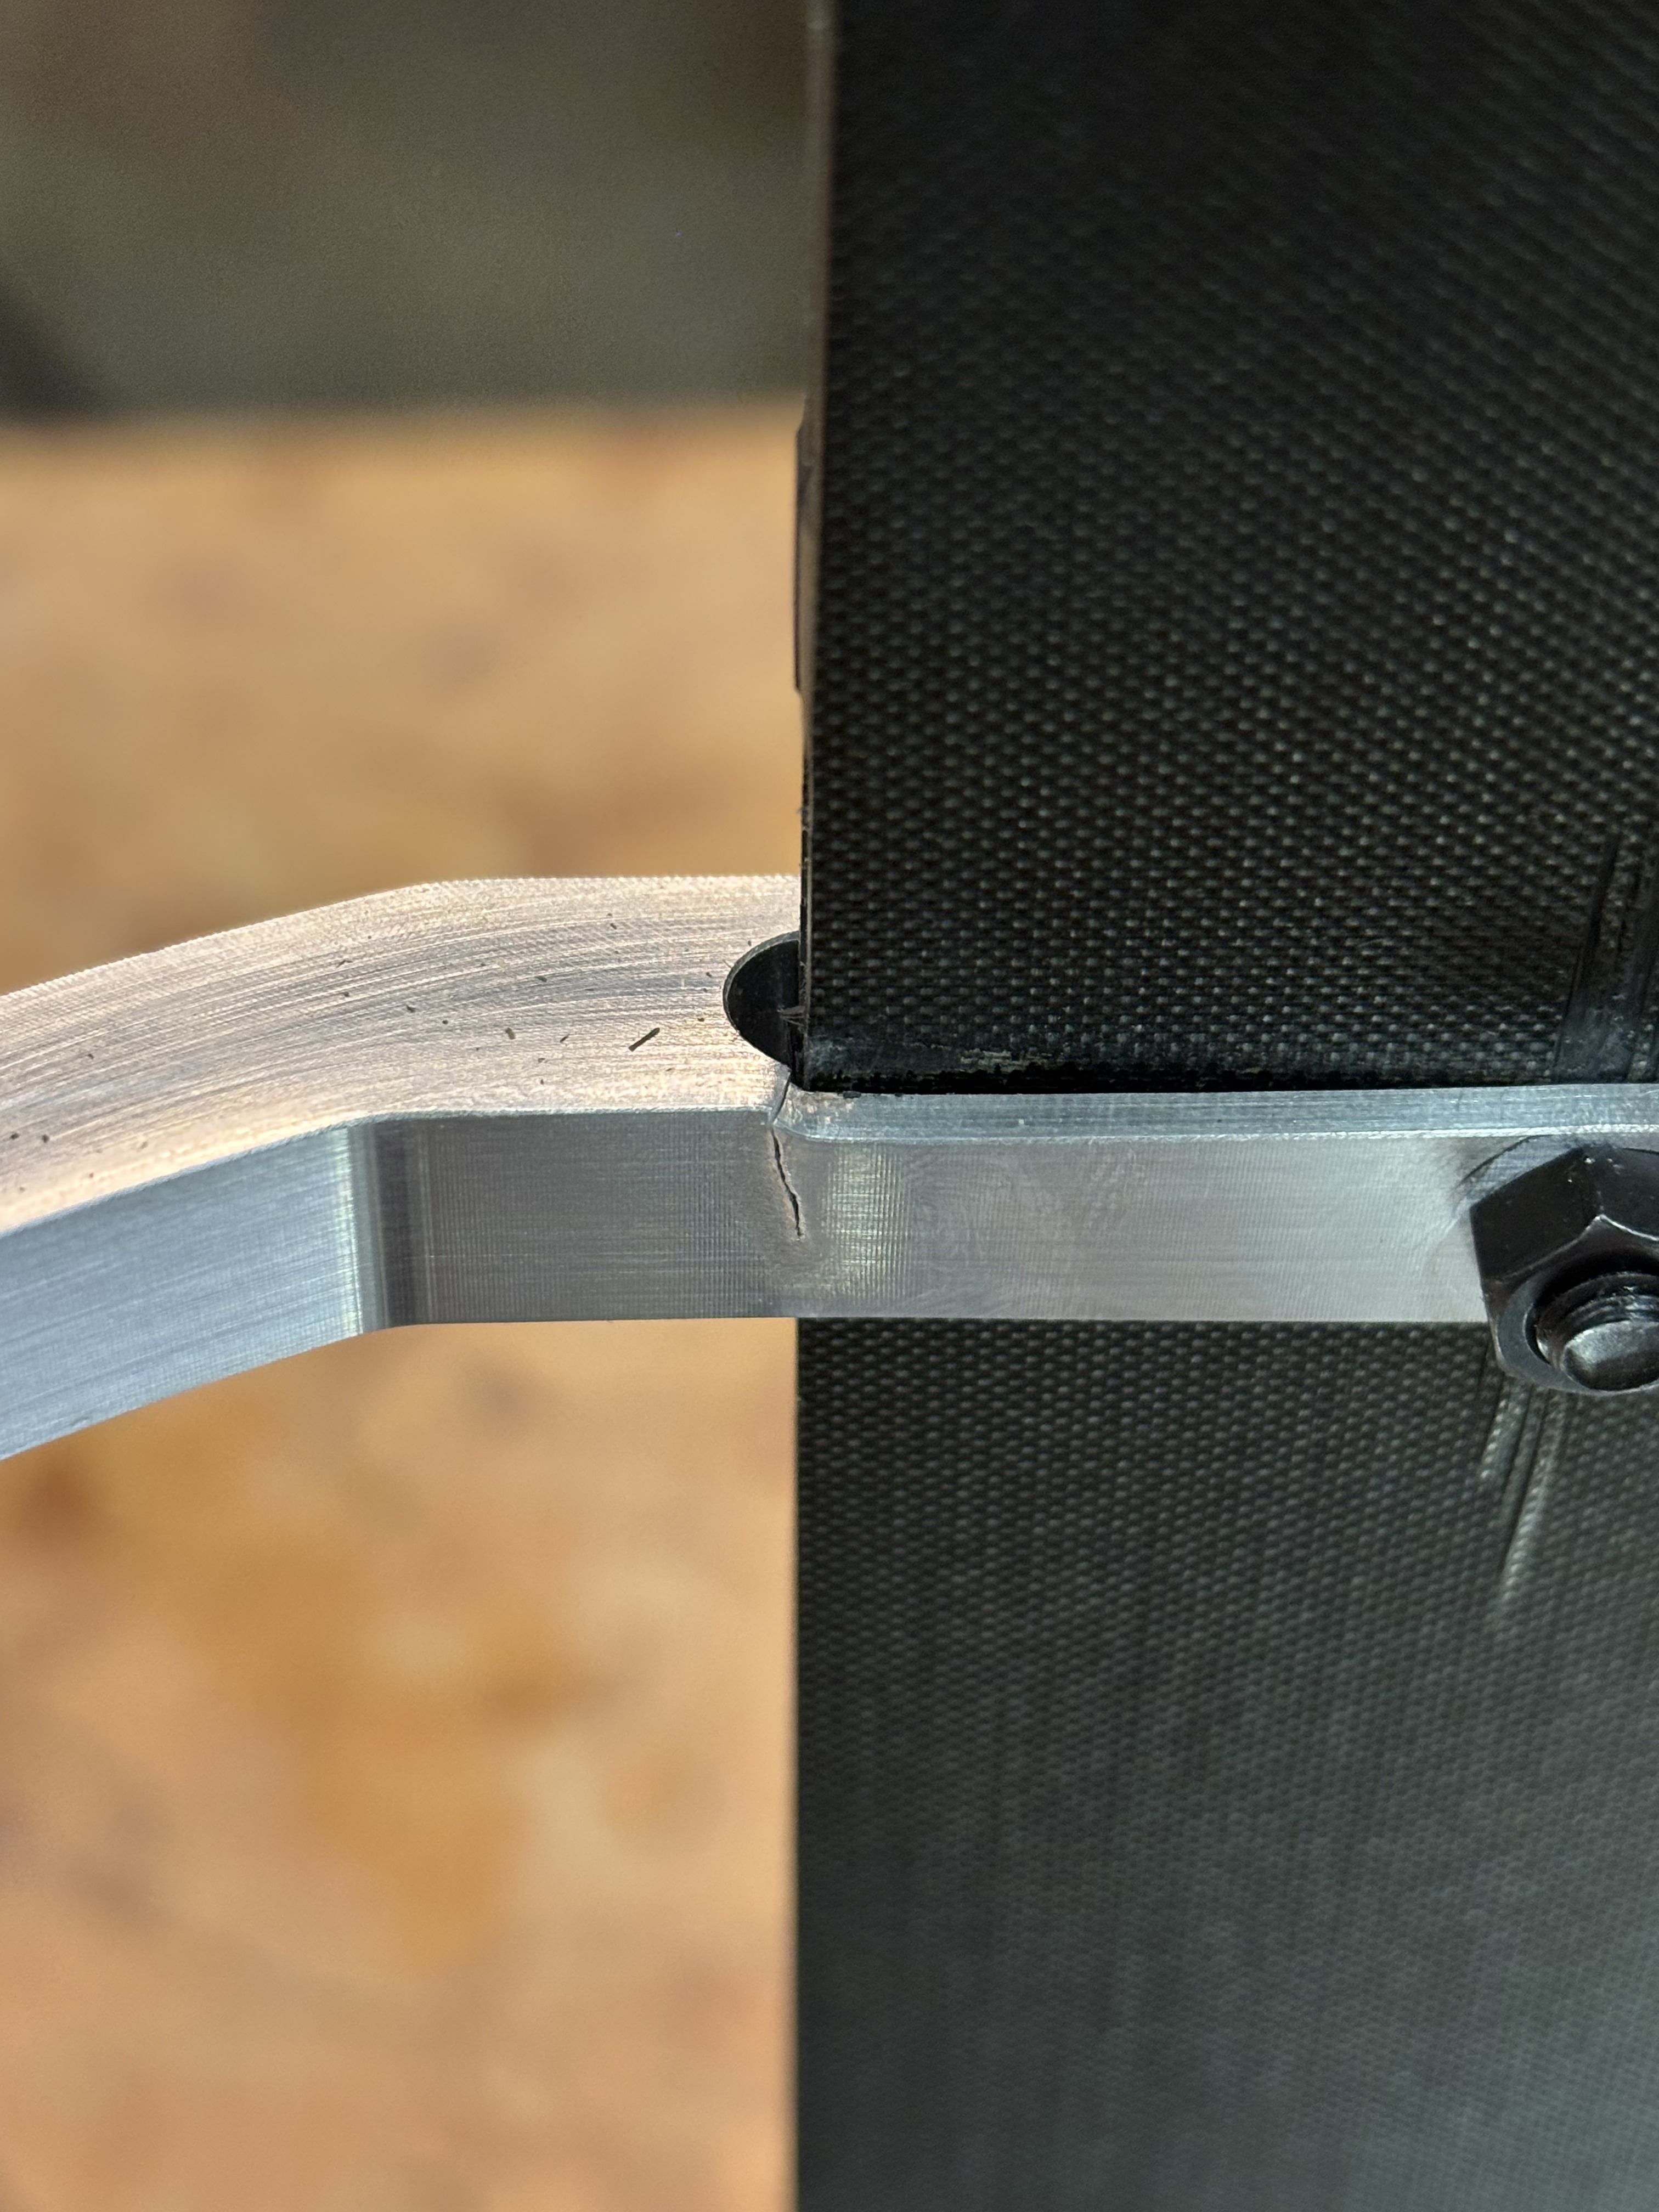
The fracture zones are consistent with expectations. A crack appeared on the outer layers at the center of two rods, perpendicular to their length. This is due to these layers experiencing the greatest tensile stress and being the first to break. Delamination also occurred between the layers in each rod. This can be explained by the fact that the interlaminar bonds did not withstand the applied load.
| |
| |
|
| Crack in center of right rod | Delamination of the right rod |
|---|
| |
| |
|
| Crack in center of rear rod | Delamination of rear rod |
|---|
¶ Pass Fail/Criteria
| Criteria | Pass/Fail ? |
|---|---|
| The failure load is at least twice the flight load (15 [kN]) | Pass |
| The error between the breaking load and the buckling load of the simulation is less than 10% | Pass |
The module has successfully passed the test
¶ Data Analysis
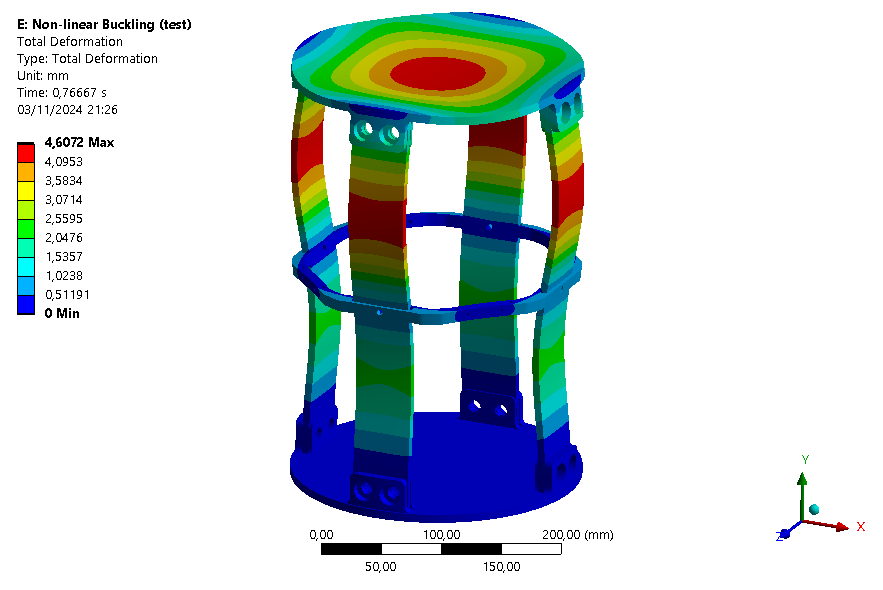
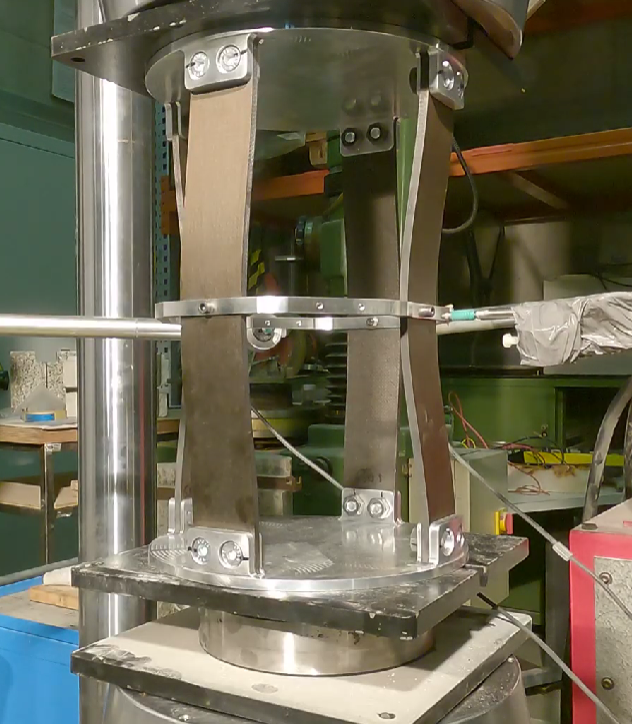
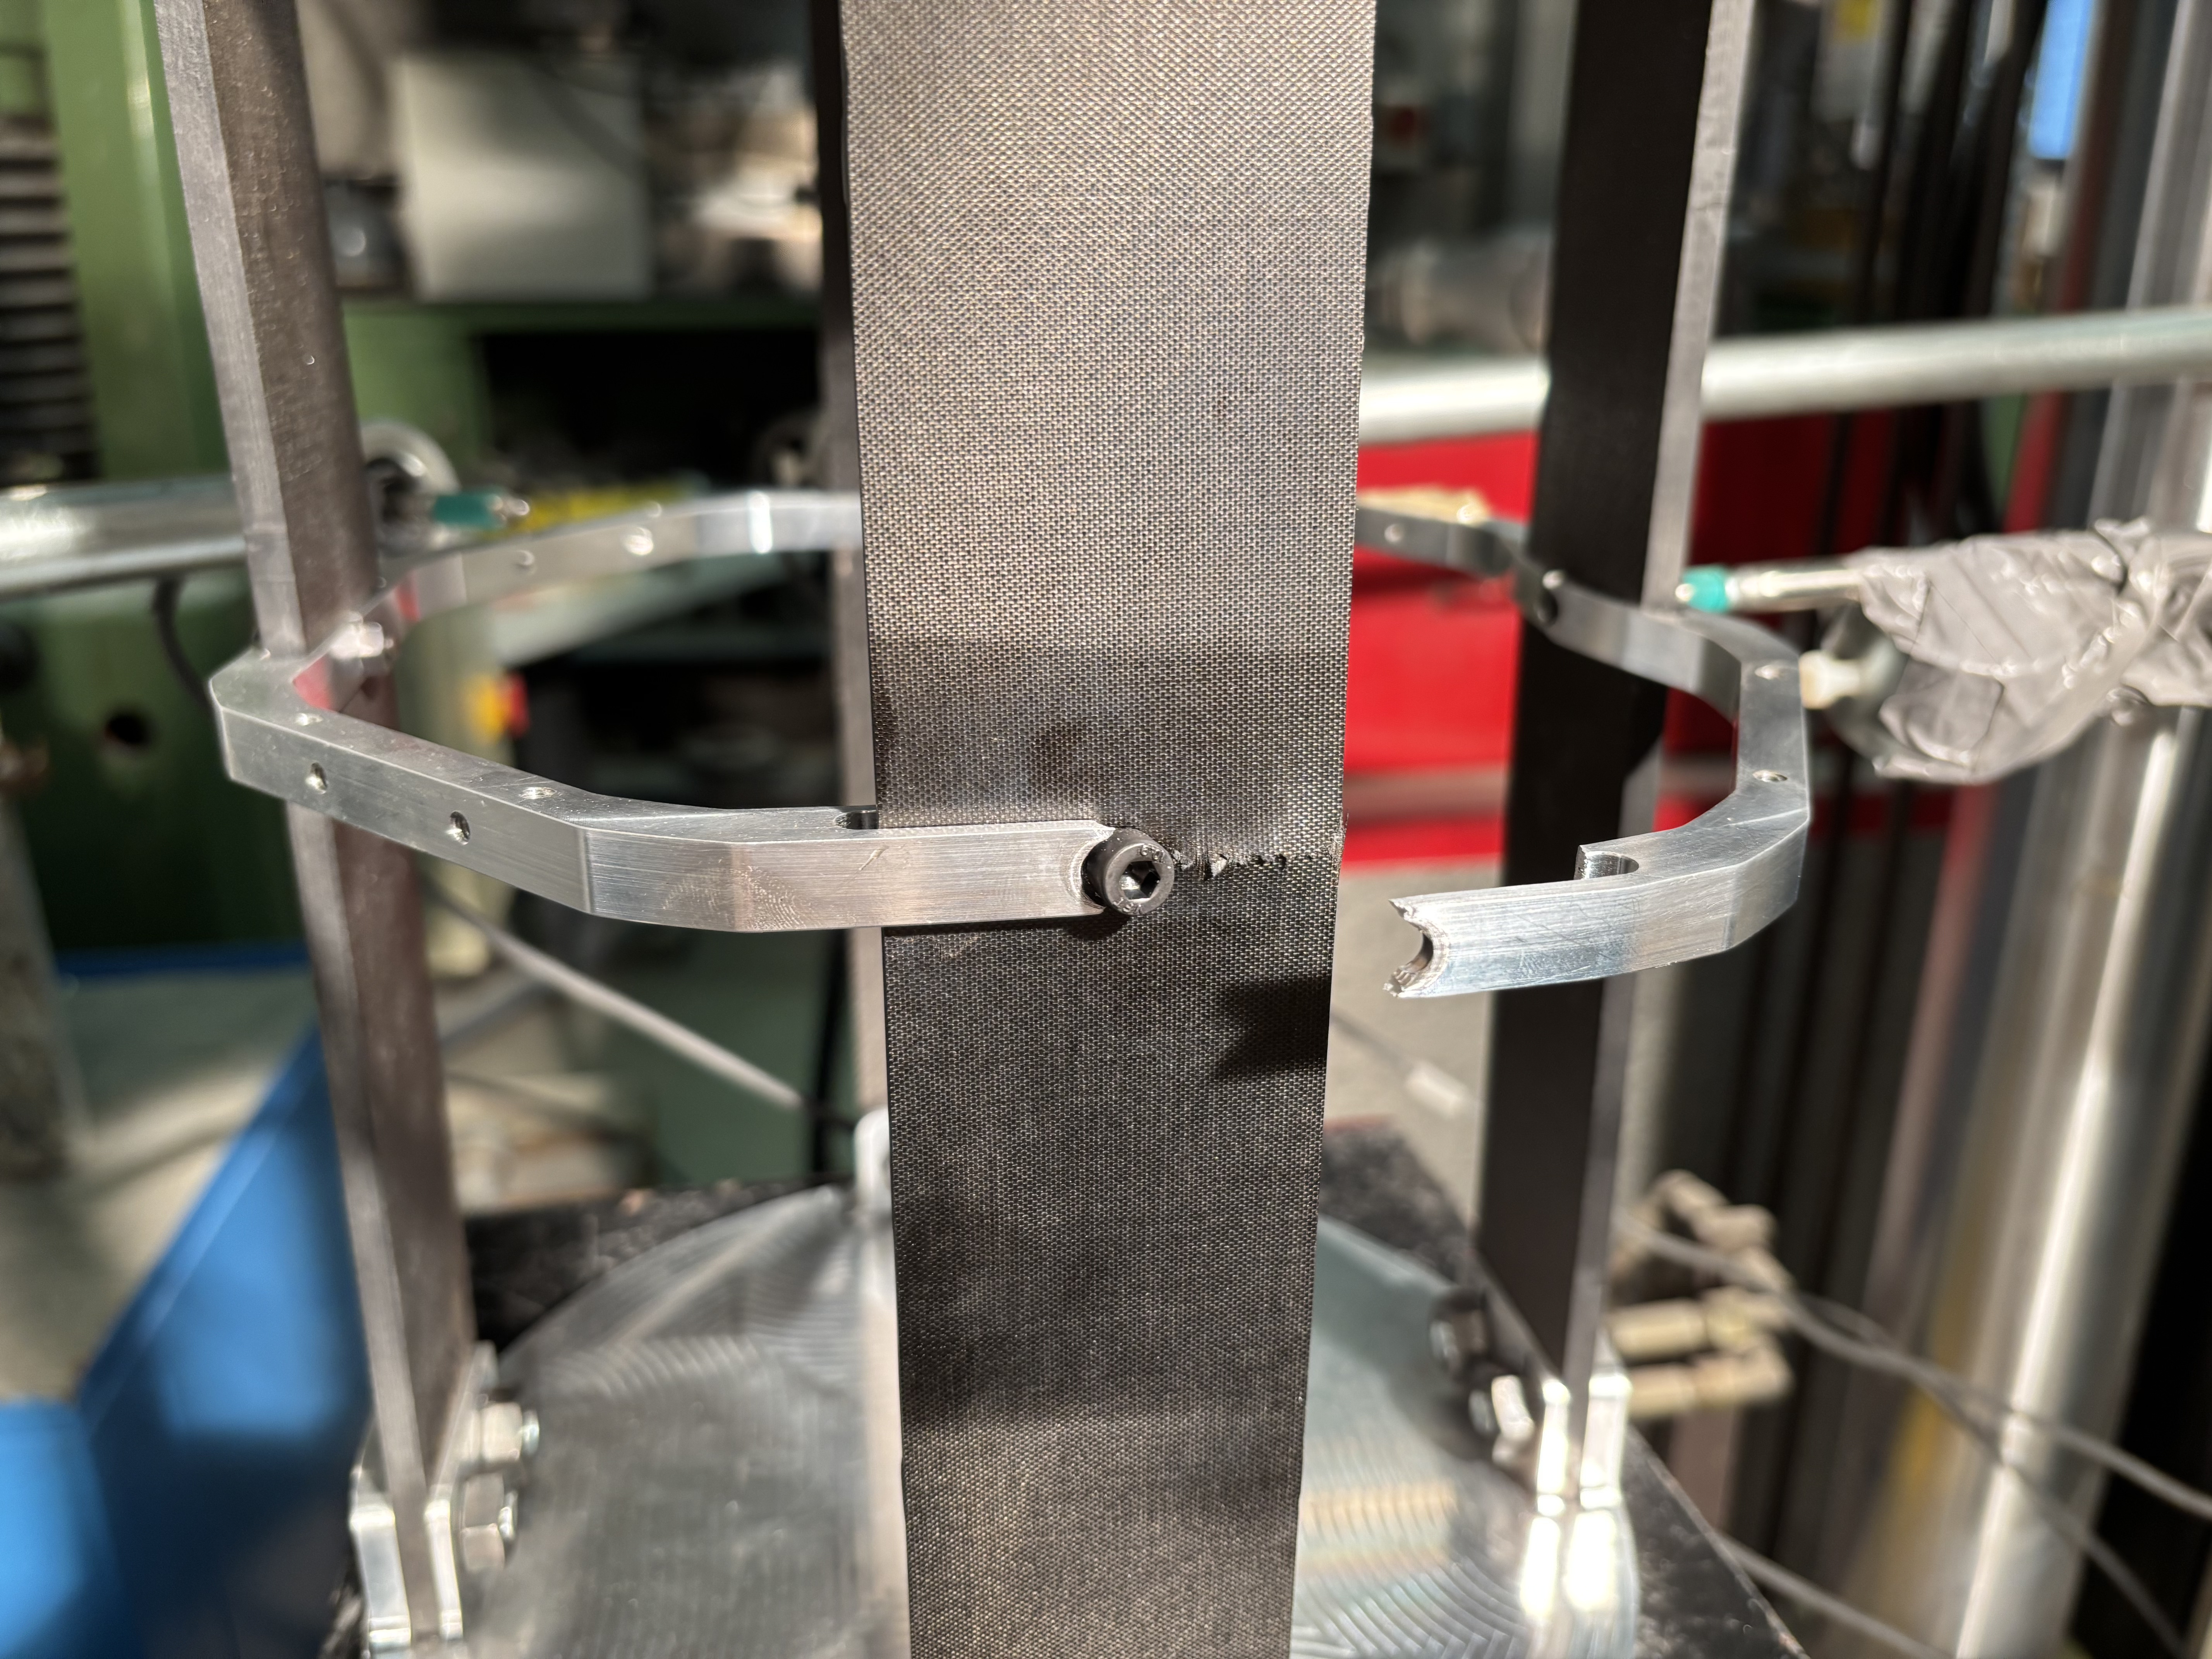
The non-linear buckling simulation gave a result such that the module deformed in the second mode with the top rods moving outwards and the bottom rods inwards. As shown in the figure below, the module did not behave exactly as simulated. One pair of rods moved outwards and one pair of rods inwards. This behaviour can be explained by the fact that the anti-buckling ring deformed and broke before the rods, preventing the second buckling mode from occurring.
| |
| |
| |
|
| Second buckling mode | Non-linear buckling simulation | Module under load |
|---|
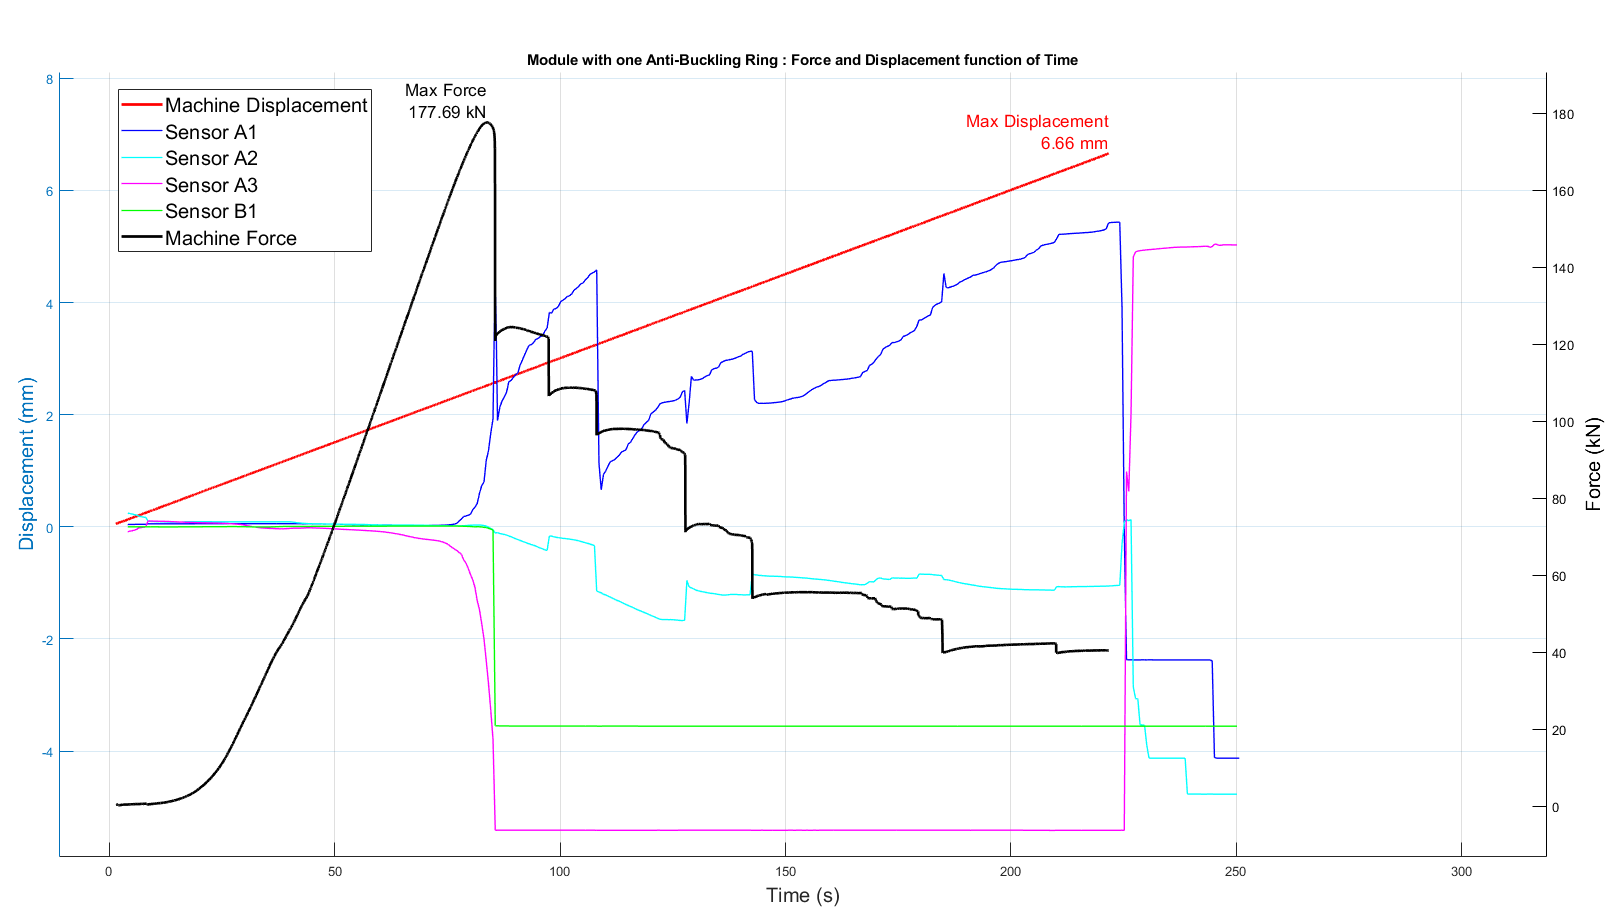
The force reached the maximum value of 177.69 [kN], which is the value at which the module began to buckle. The machine displacement at the maximal force is 2.52 [mm] and the maximal machine displacement is 6.66 [mm]. The first drop in force between 177 [kN] and 124 [kN] corresponds to the failure of the ABR and the fracture of the right-hand rod. As sensor 3 is placed on this rod, the drop in its displacement confirms its fracture. The resulting plateau is due to the fact that the sensor is no longer in contact with the rod. With the right-hand rod fractured, the load on the other rods has increased. This can be seen in the increased displacement of the A1 sensor placed on the rear rod. The shock resulting from the fracture of the right-hand rod caused the B1 sensor on the right-hand rear quarter of the ABR to fall. This explains the drop in displacement and the subsequent plateau.
All the force drops that follow are due to repeated breakage of the ABR causing an execif displacement on the rear rod.
The A2 sensor measuring the radial displacement of the ABR in the left rear quarter shows that it has moved inwards.
Non-linear buckling simulation result : 184.64 [kN]
Test Results : 177.69 [kN]
Error : 3.9%
Safety factor on flight load (15 [kN]) : 12.3
Displacement at the maximal force : 2.52 [mm]
As predicted in the simulations, the anti-buckling ring deformed and broke before the rods. This is because the anti-buckling ring was designed for a load twice as high as the flight load, i.e., 15 [kN]. However, this test showed that adding an anti-buckling ring significantly increases the rupture load. Based on the results obtained from the previous module test, the addition of the ring increases the load by 1.9 times, demonstrating its effectiveness. Another important point to note is that the ABR screws did not break, indicating that their sizing was correctly performed. The maximum value reached of 177.69 [kN] gives an error of 3.9% compared with the simulated value. The safety factor in relation to the flight load is 12.3.
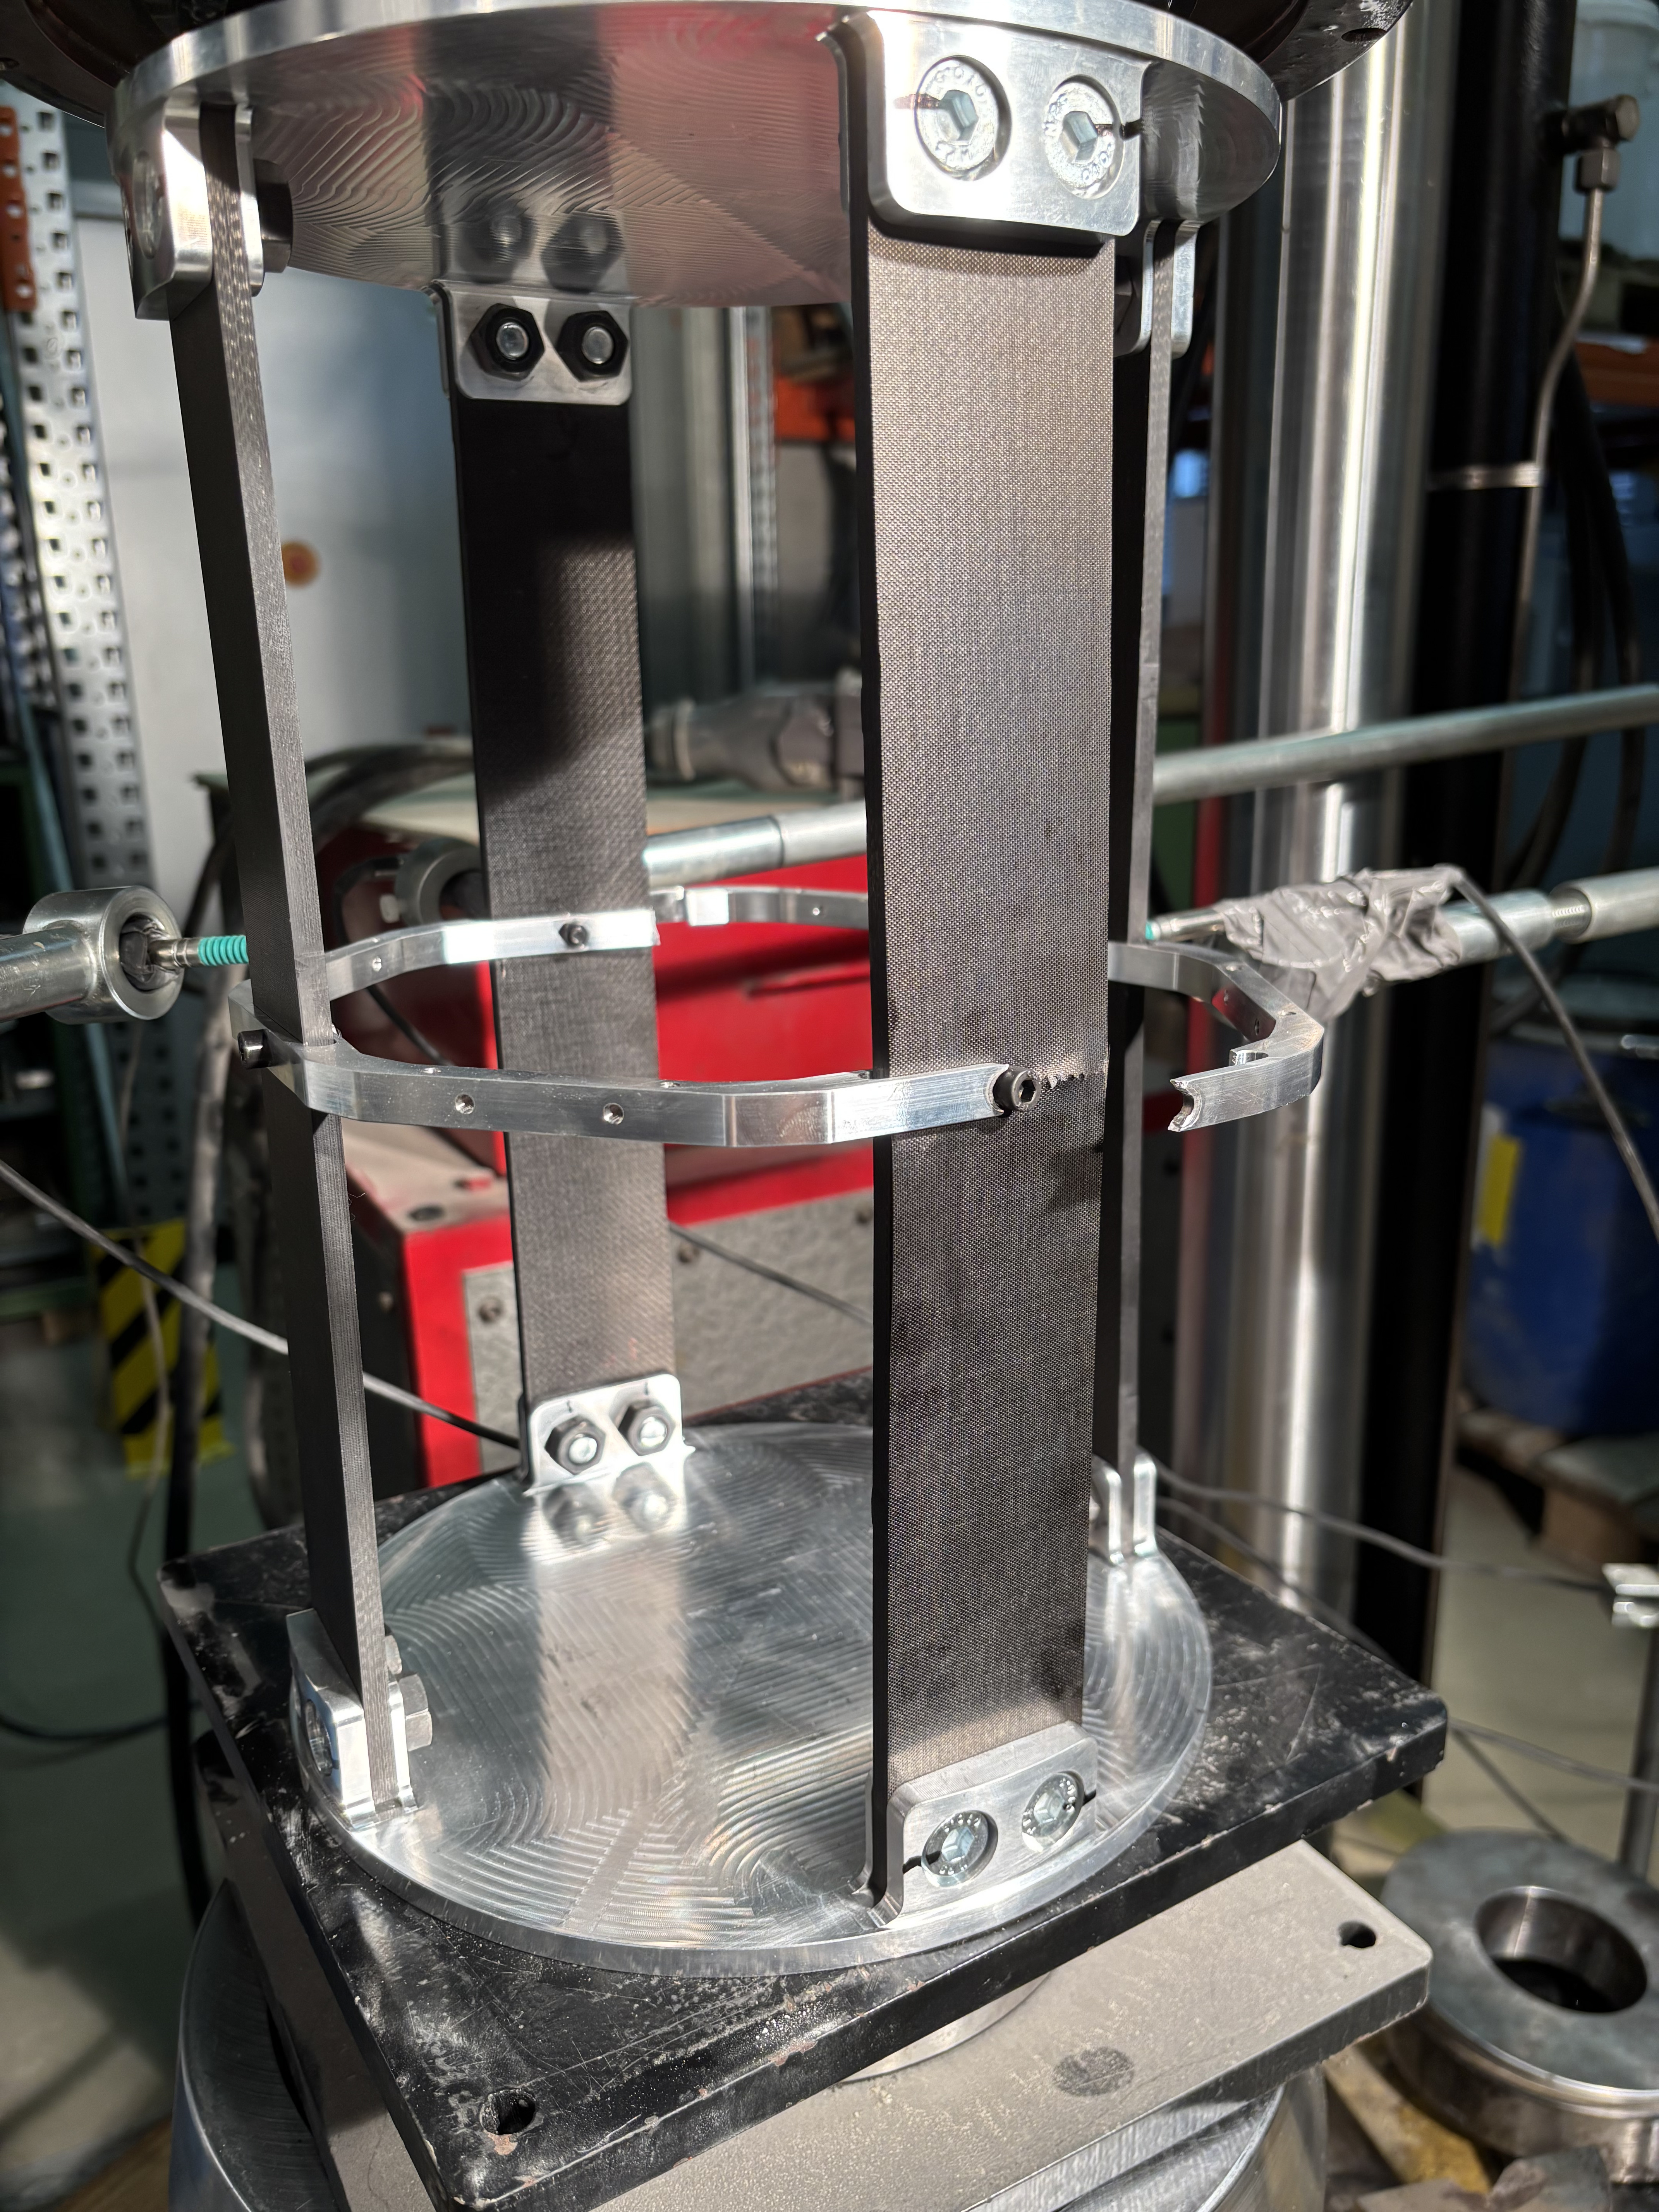
The failure points of the ABR appeared in areas with little material, where the stresses were highest. These areas are located near the screws and around the rods. Thin walls are necessary in these regions to allow the screws to deform the aluminum and apply enough force to secure the rods.
| |
| |
|
| Module after buckling | ABR fracture close to the screw |
|---|
| |
| |
|
| ABR fracture close to the Nut | ABR fracture in the corner of the rods hole |
|---|
¶ Pass Fail/Criteria
| Criteria | Pass/Fail ? |
|---|---|
| The failure load is at least twice the flight load (15 [kN]) | Pass |
| The error between the breaking load and the buckling load of the simulation is less than 10% | Pass |
| Adding an ABR increases the breaking load by at least 1.5 times | Pass |
The module has successfully passed the test
¶ Data Analysis
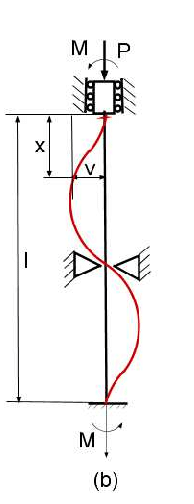
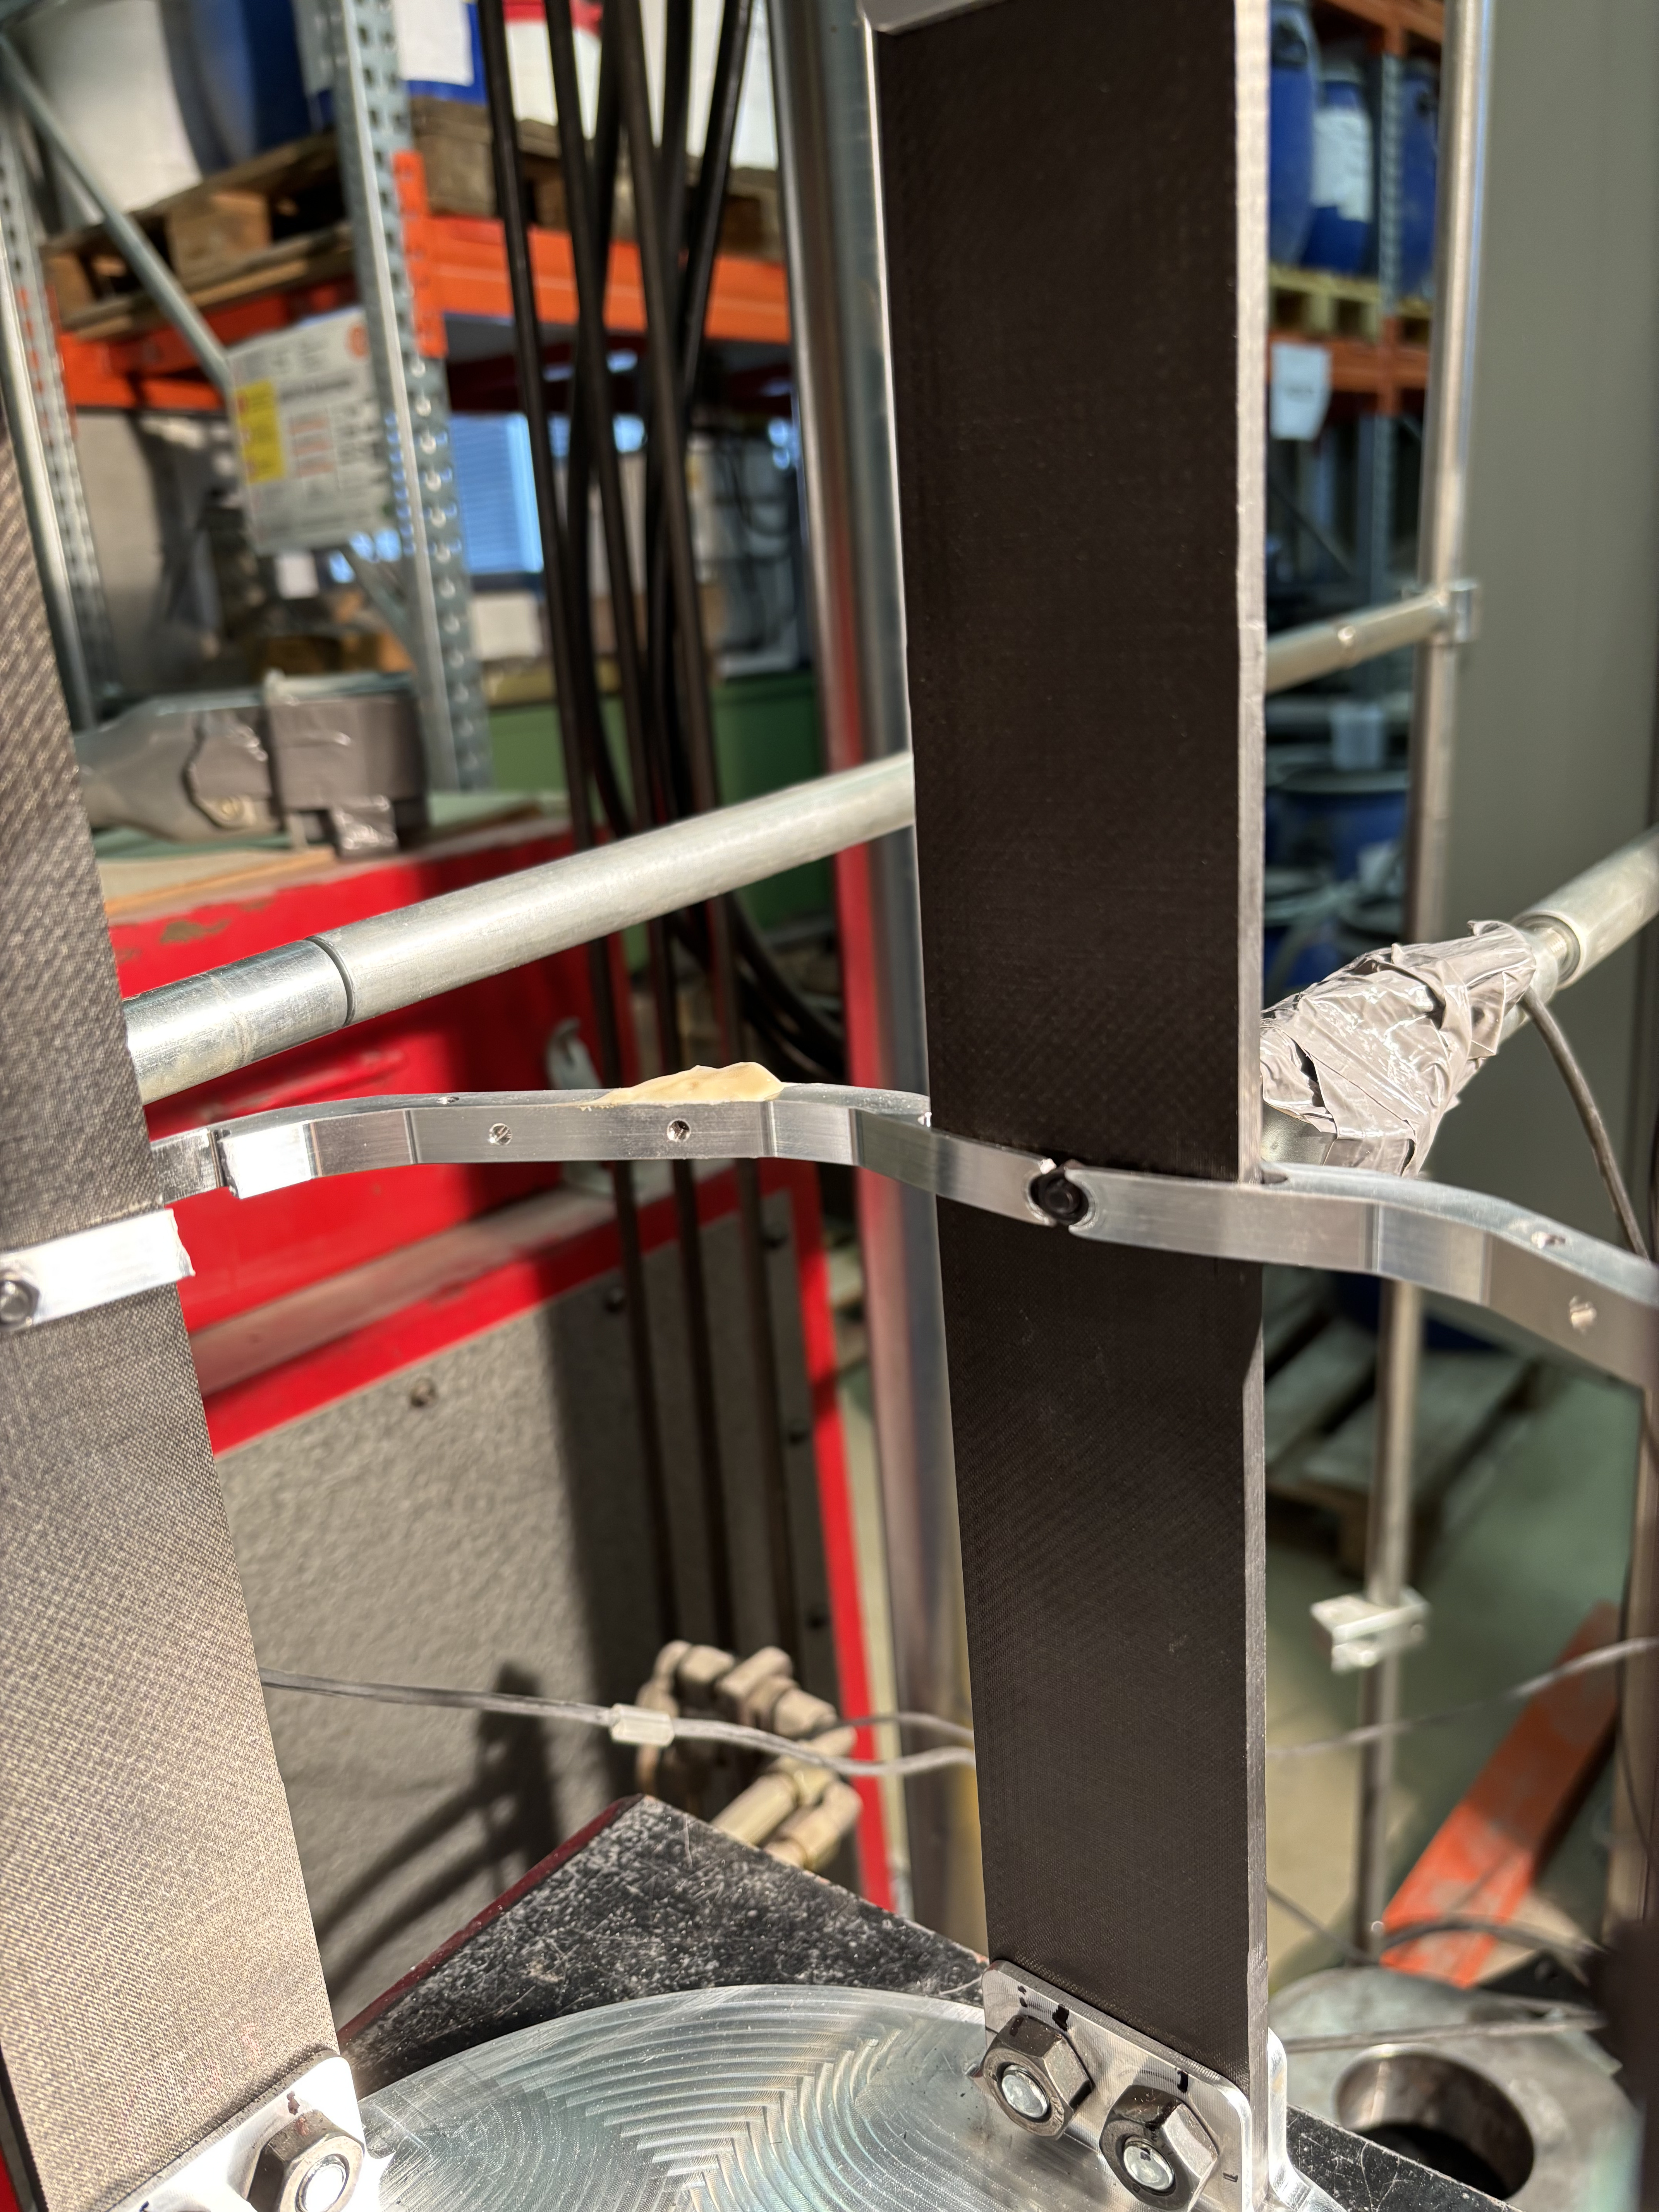
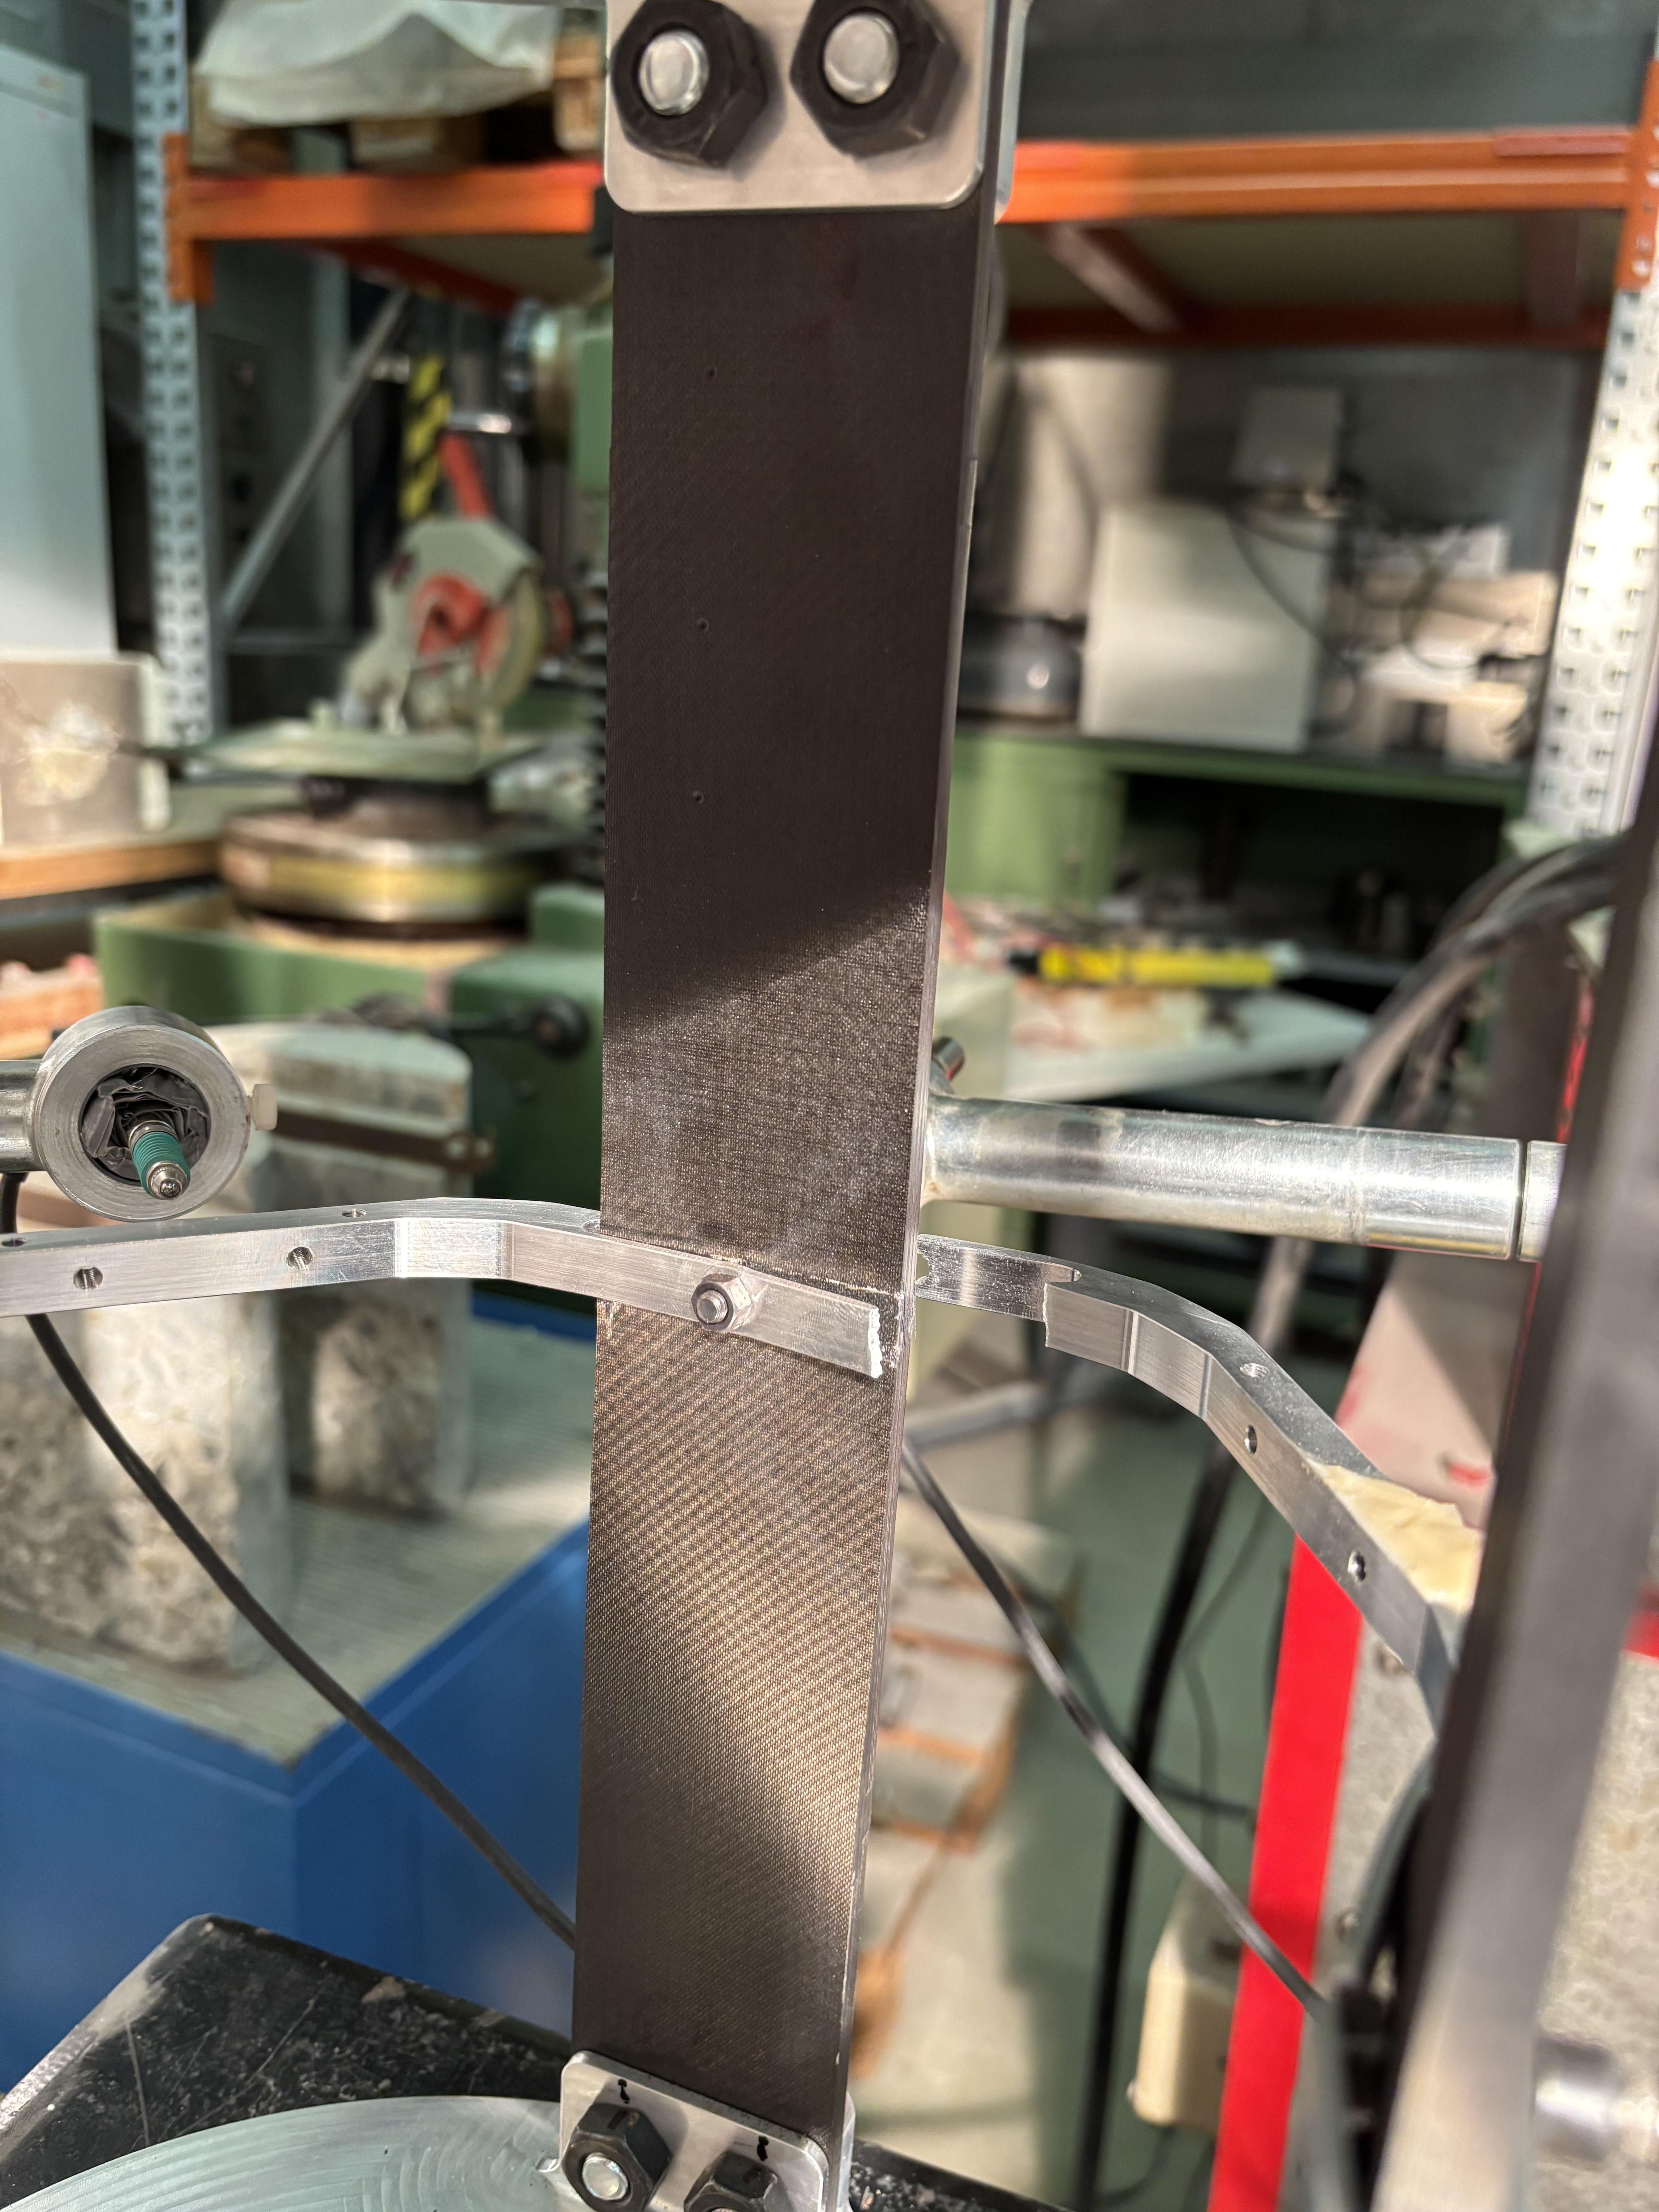
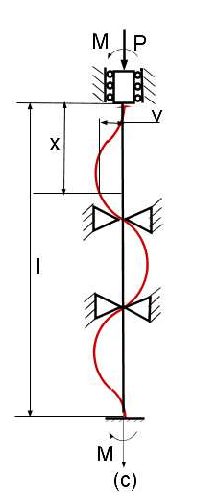
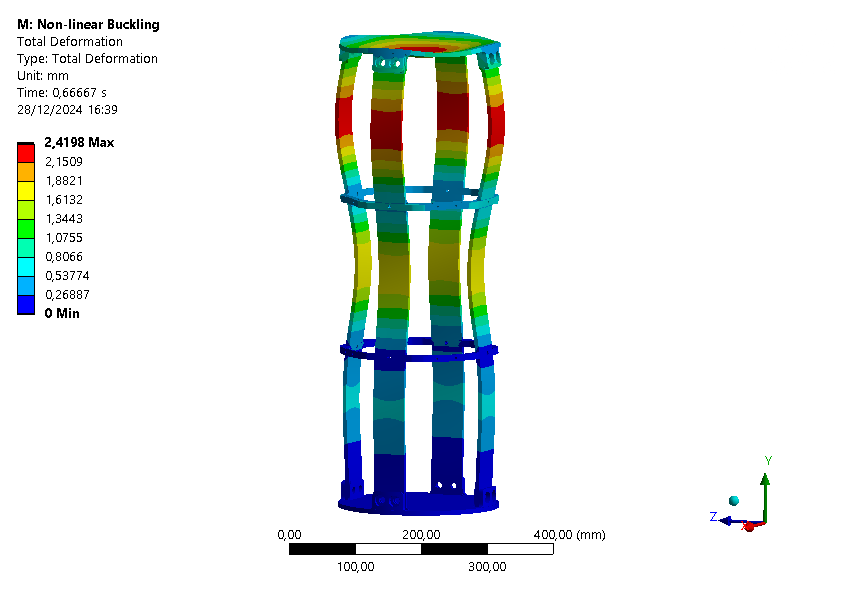
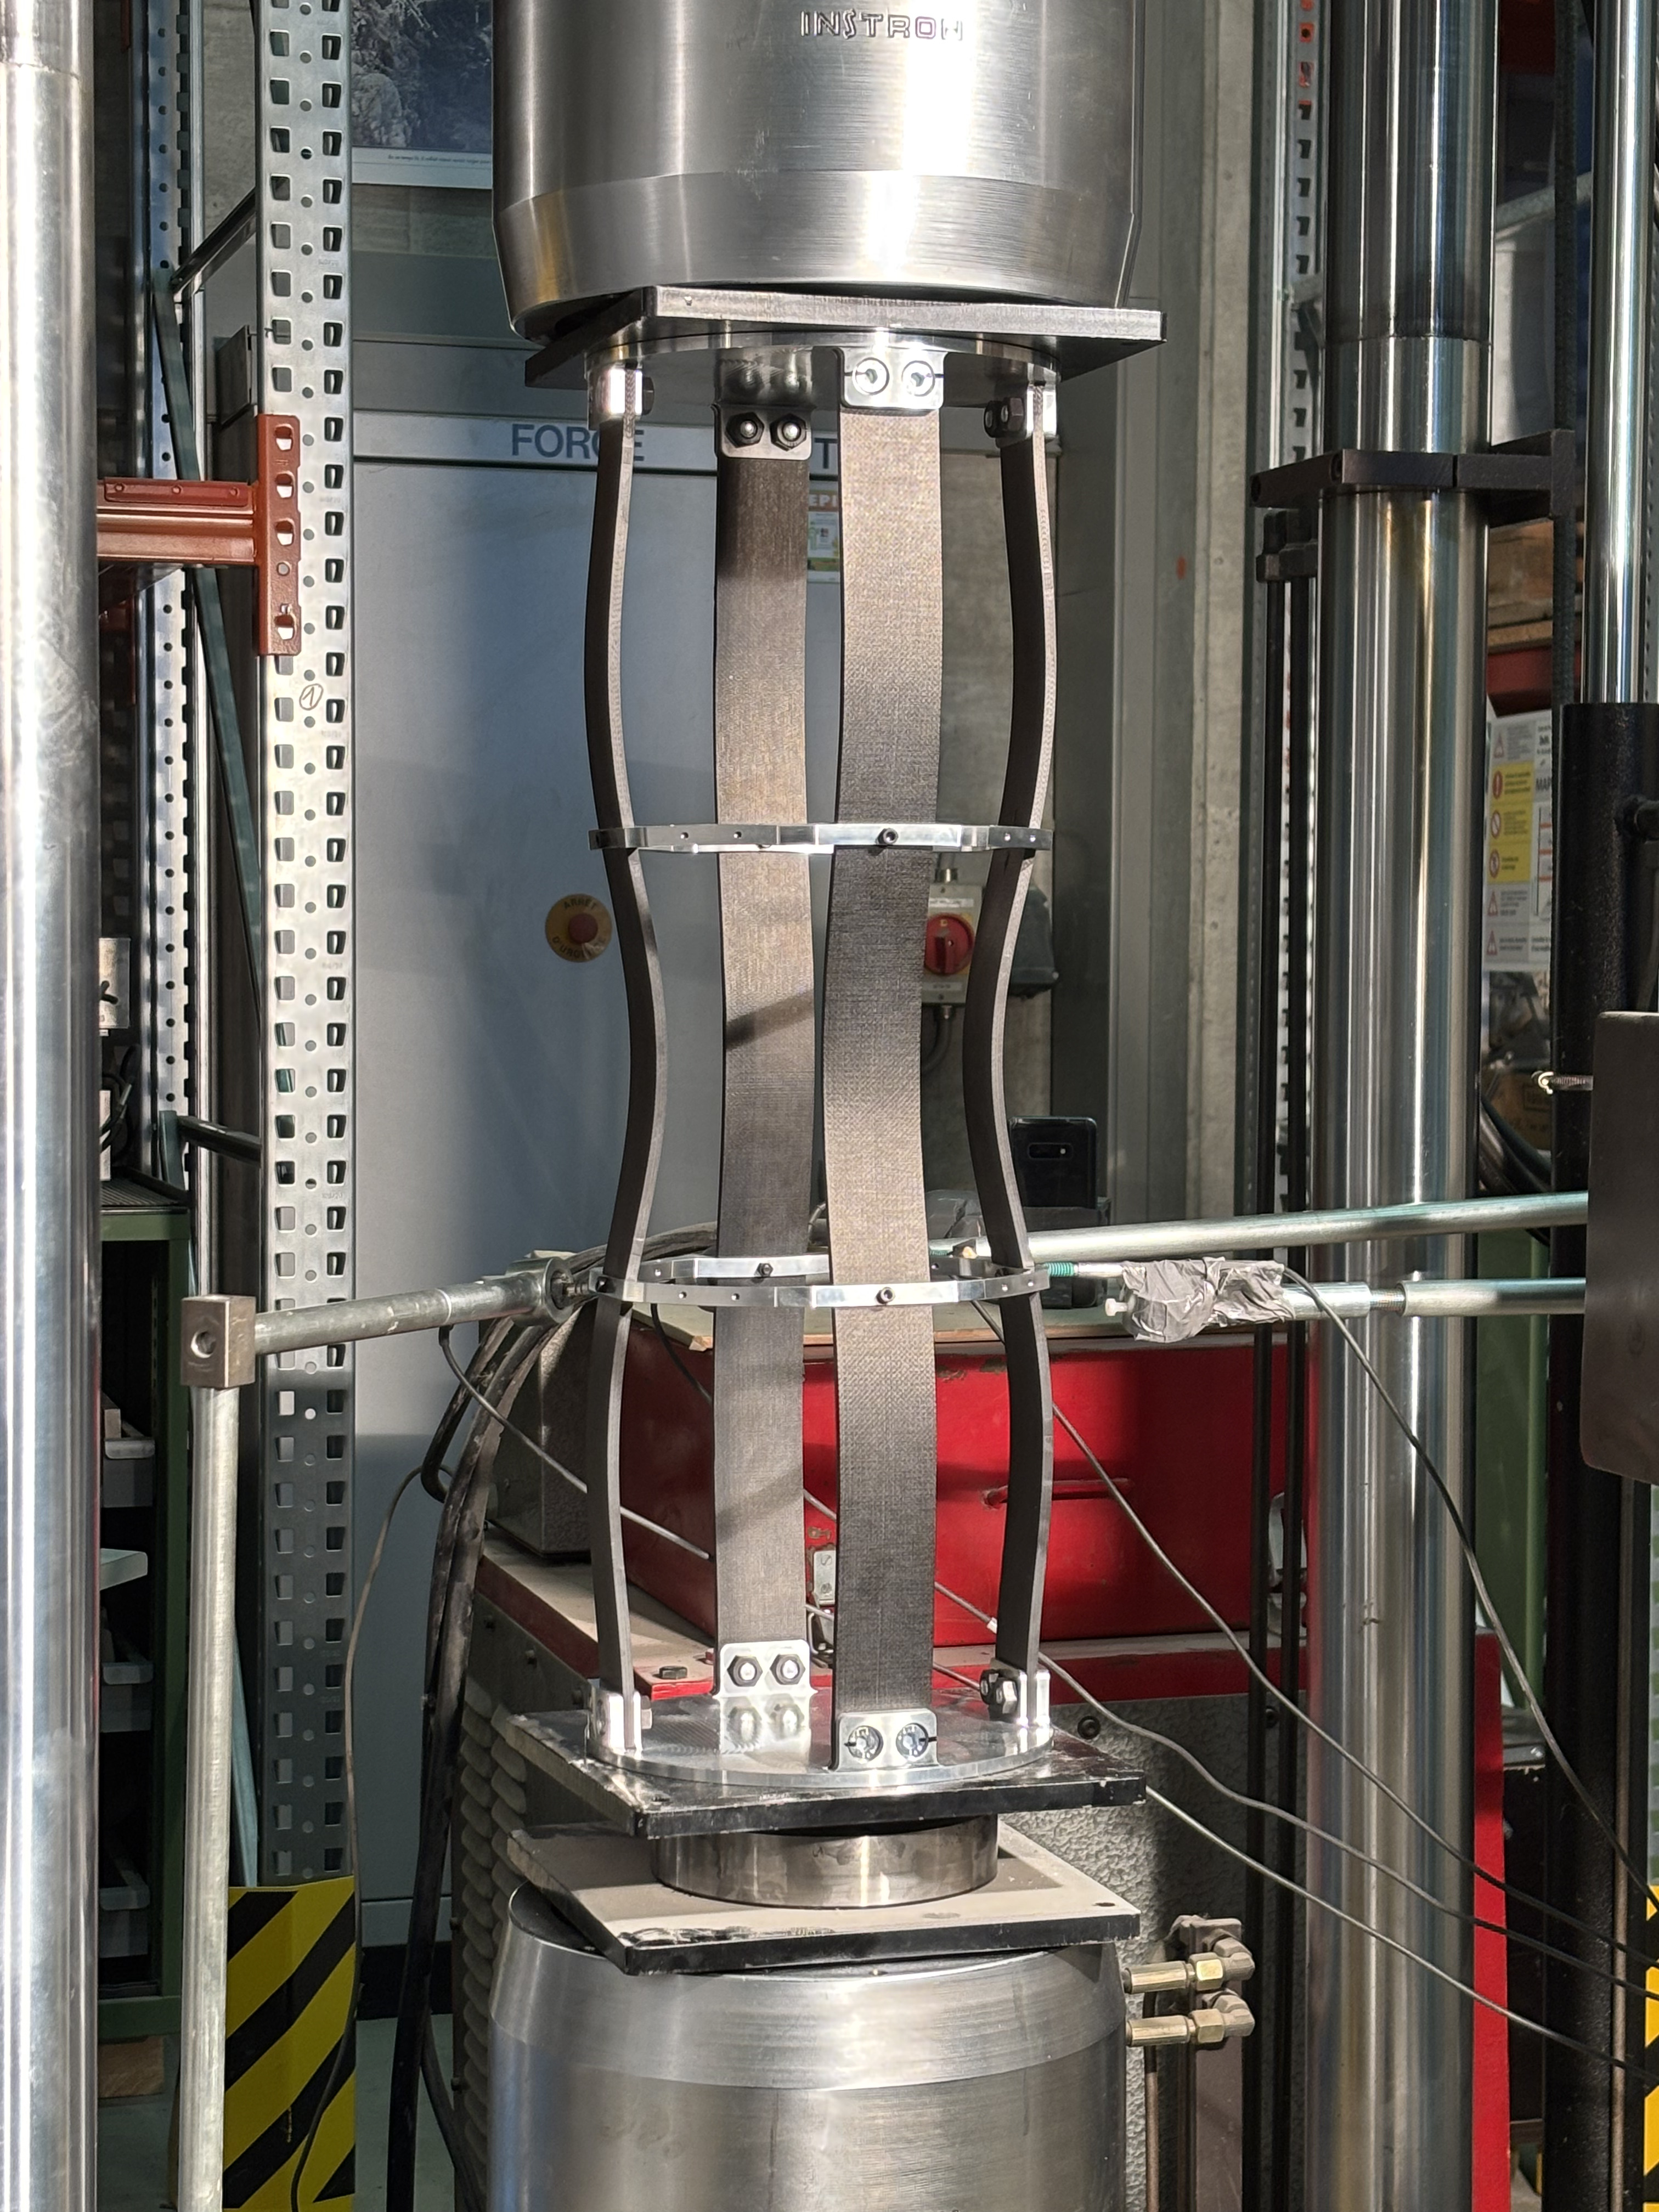
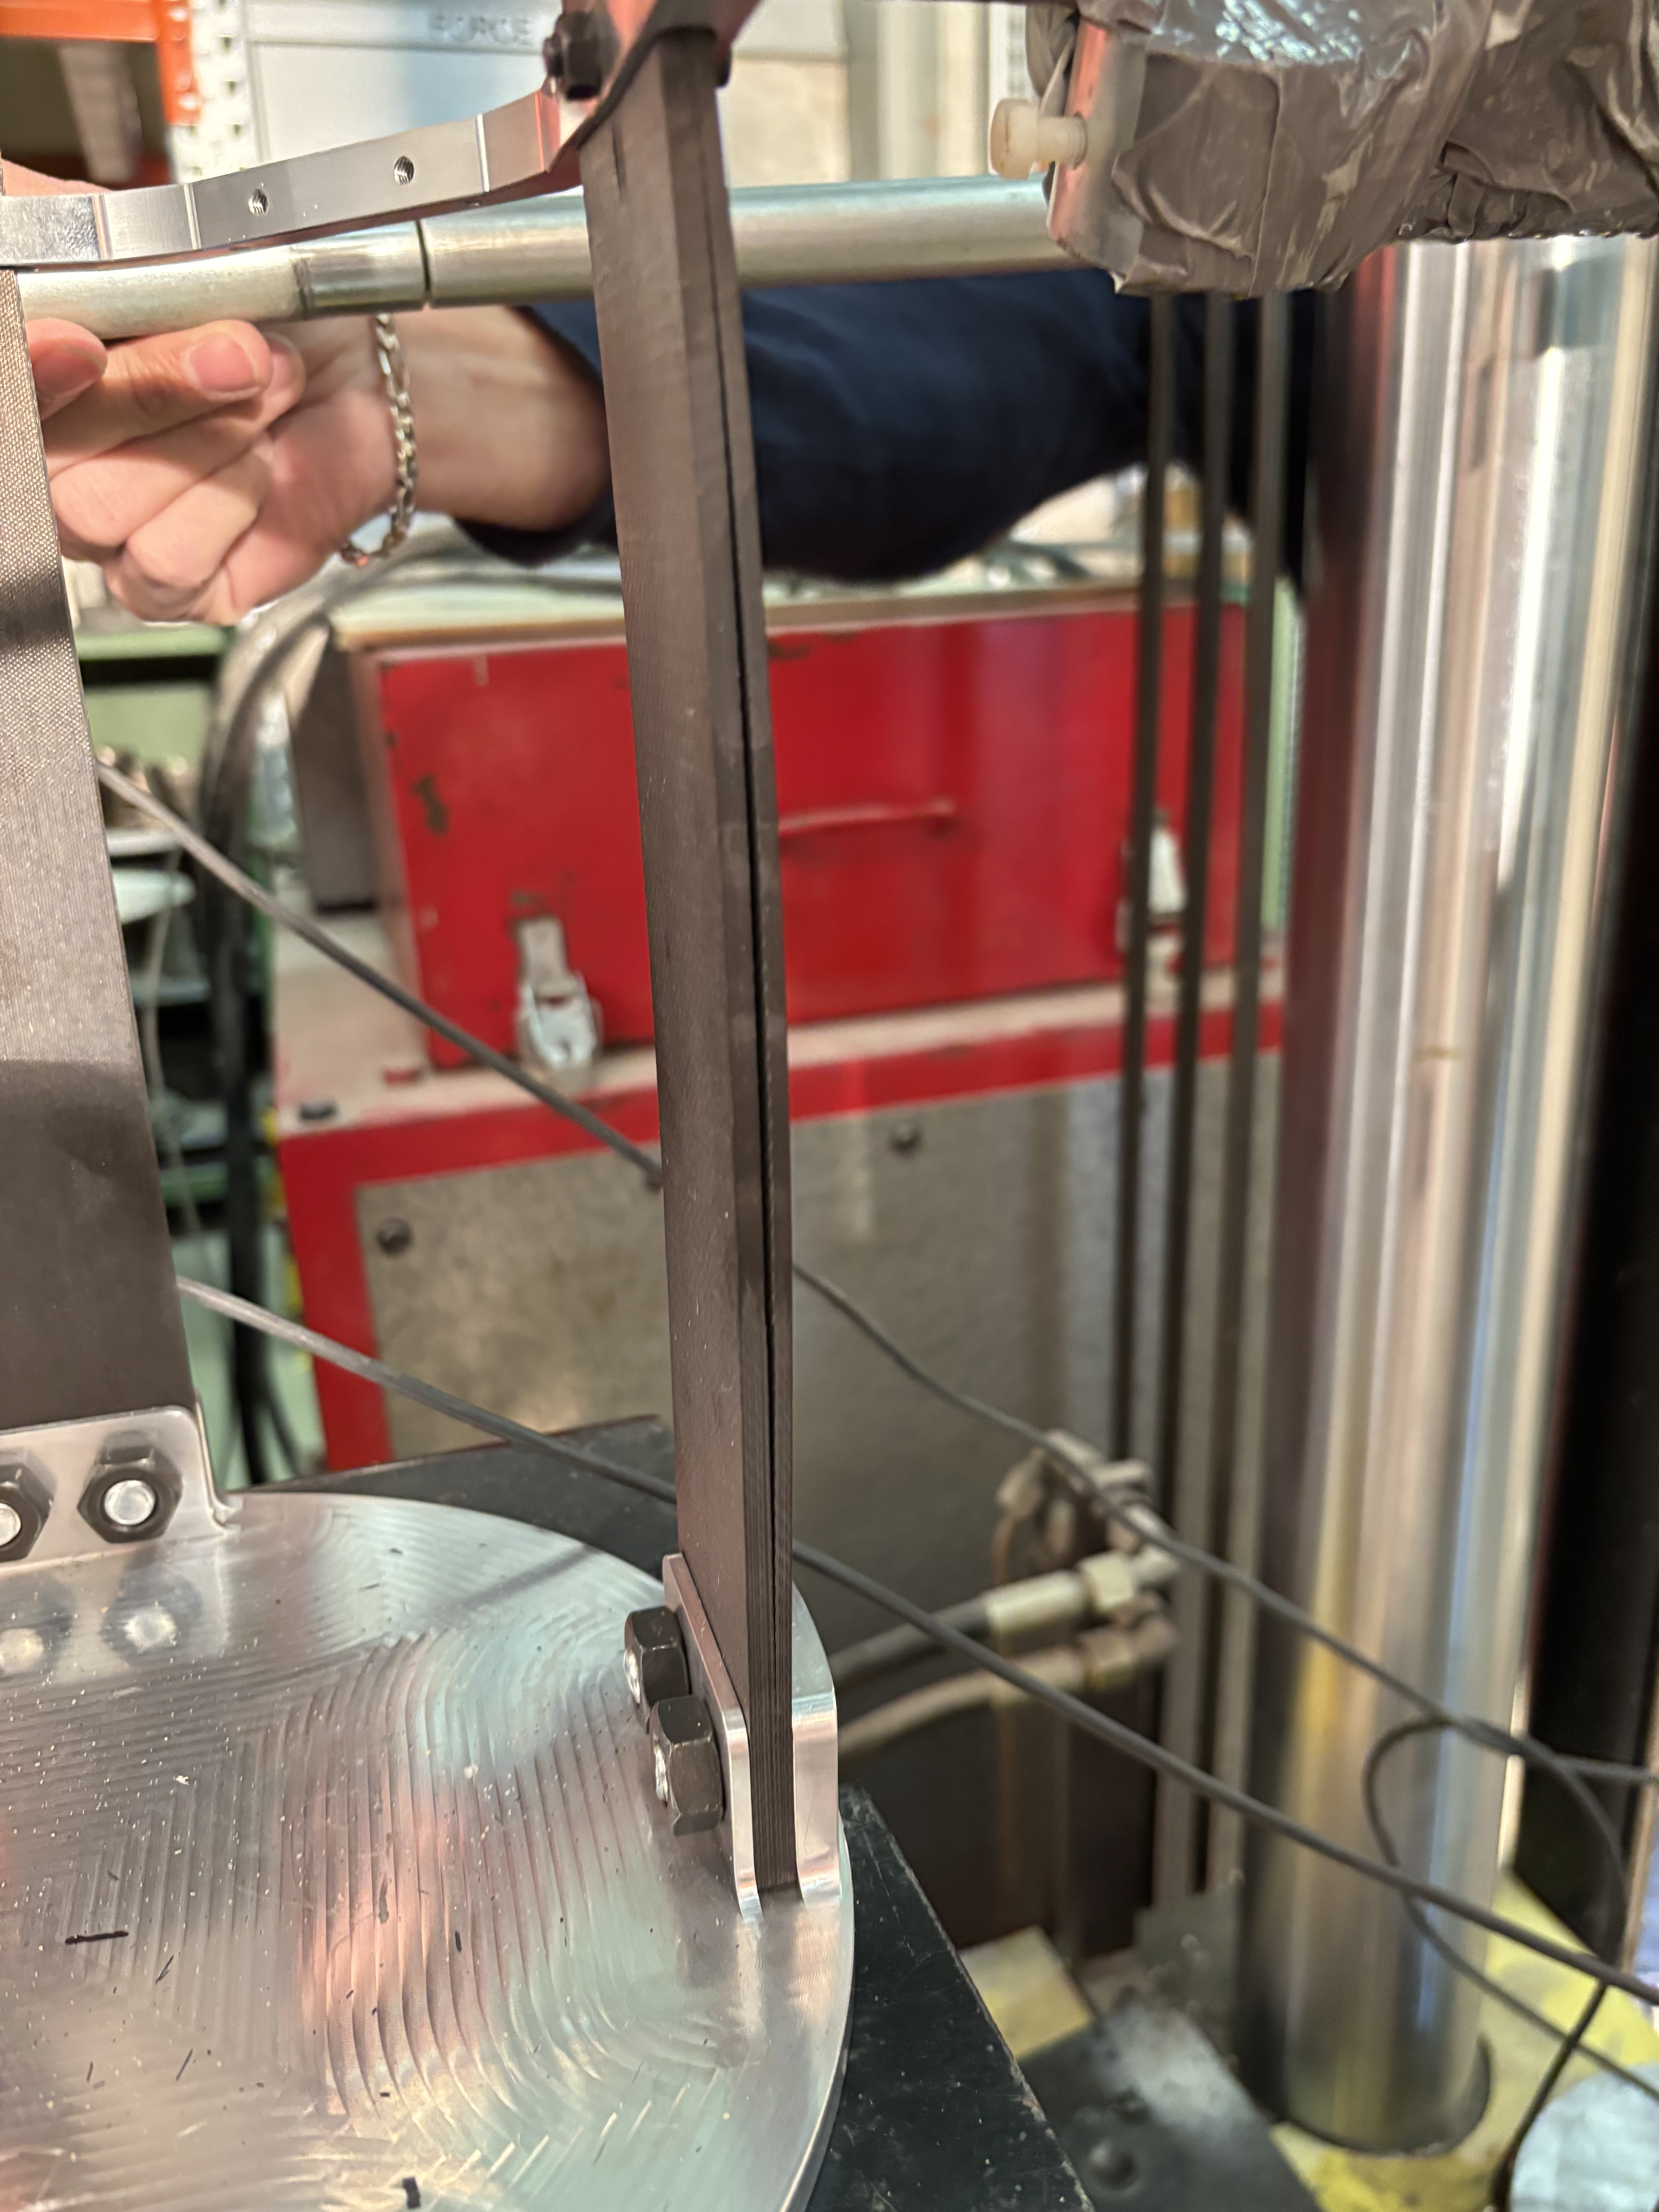
The non-linear buckling simulation gave a result such that the module deformed in the third mode with a sinusoidal shape for the rod. As shown in the figure below, the module did indeed deform as simulated.
| |
| |
| |
|
| Third buckling mode | Non-linear buckling simulation | Module under load |
|---|
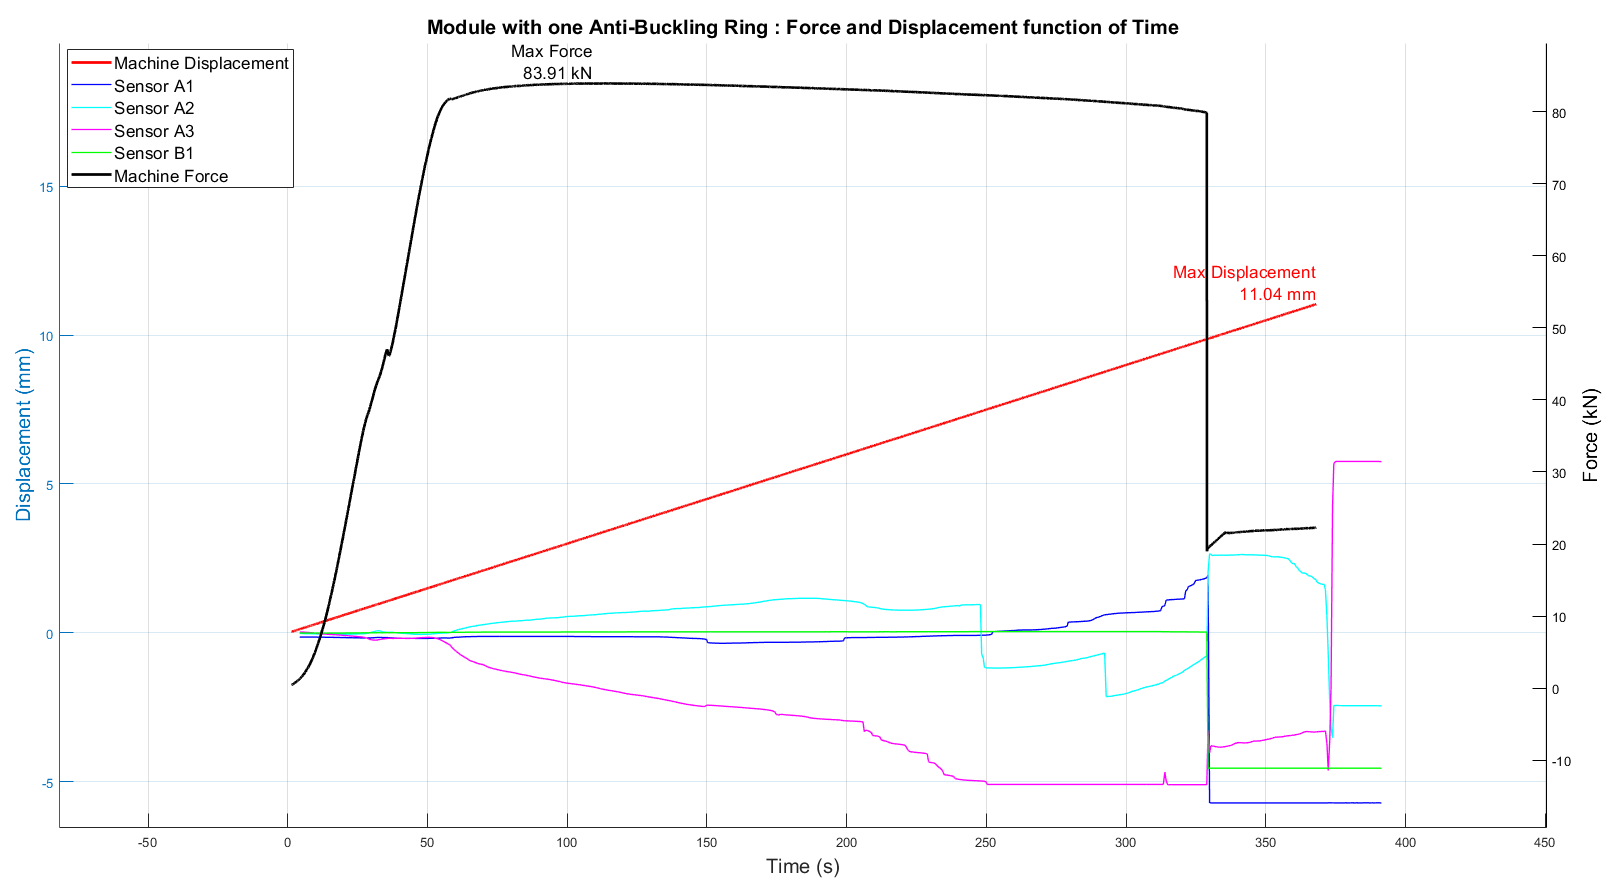
The force reached the maximum value of 83.91 [kN], which is the value at which the module began to buckle. The machine displacement at the maximal force is 3.27 [mm] and the maximal machine displacement is 11.04 [mm]. When the maximum force was reached, the antibuckling rings began to buckle. The A3 sensor reached a plateau at 250 [s] because it was no longer in contact. The drop in force from 83 [kN] to 21 [kN] was caused by the front rod breaking. Sensor B1 was ejected by the impact of the shock, which explains the sudden drop in its displacement. The stair-step fall of sensor A2 can be explained by the various cracks that appeared on the ABR. Surprisingly, however, this is not reflected in the force curve.
Non-linear buckling simulation result : 81.32 [kN]
Test Results : 83.91 [kN]
Error : 3.1%
Safety factor on flight load (15 [kN]) : 5.59
Displacement at the maximal force : 3.27 [mm]
The maximum value reached of 83.91 [kN] gives an error of 3.9% compared with the simulated value. The safety factor in relation to the flight load is 5.59.
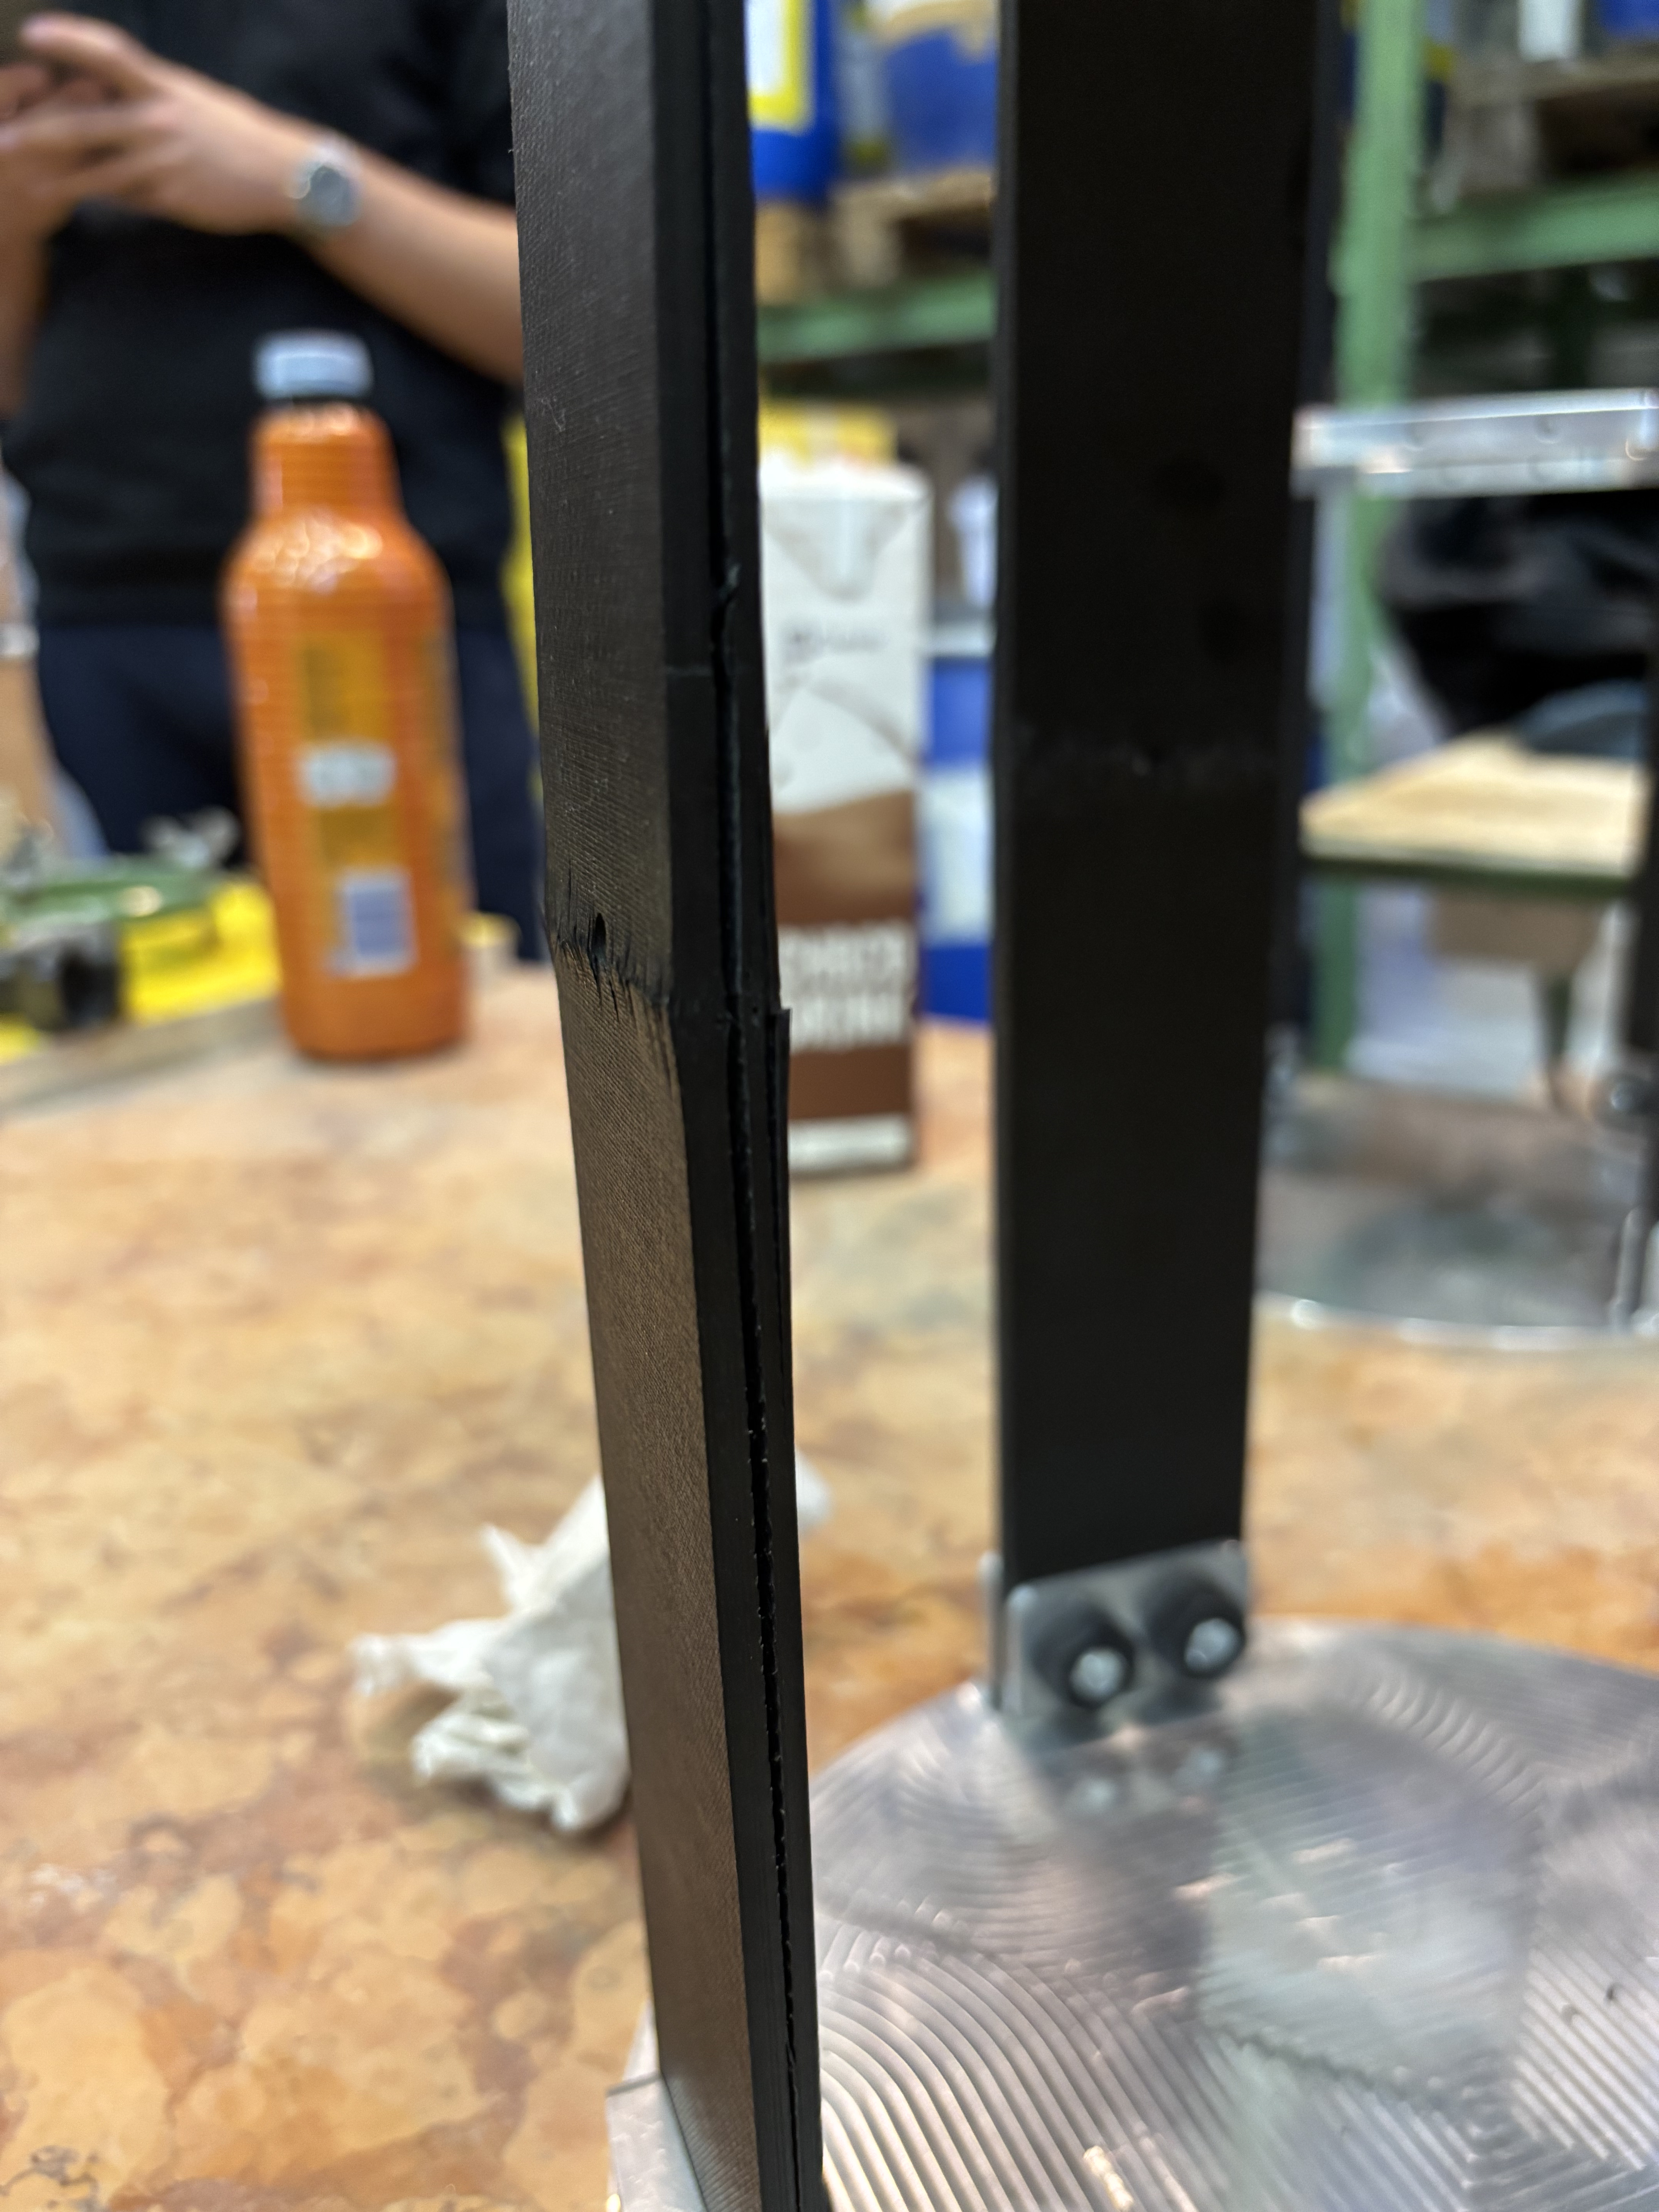
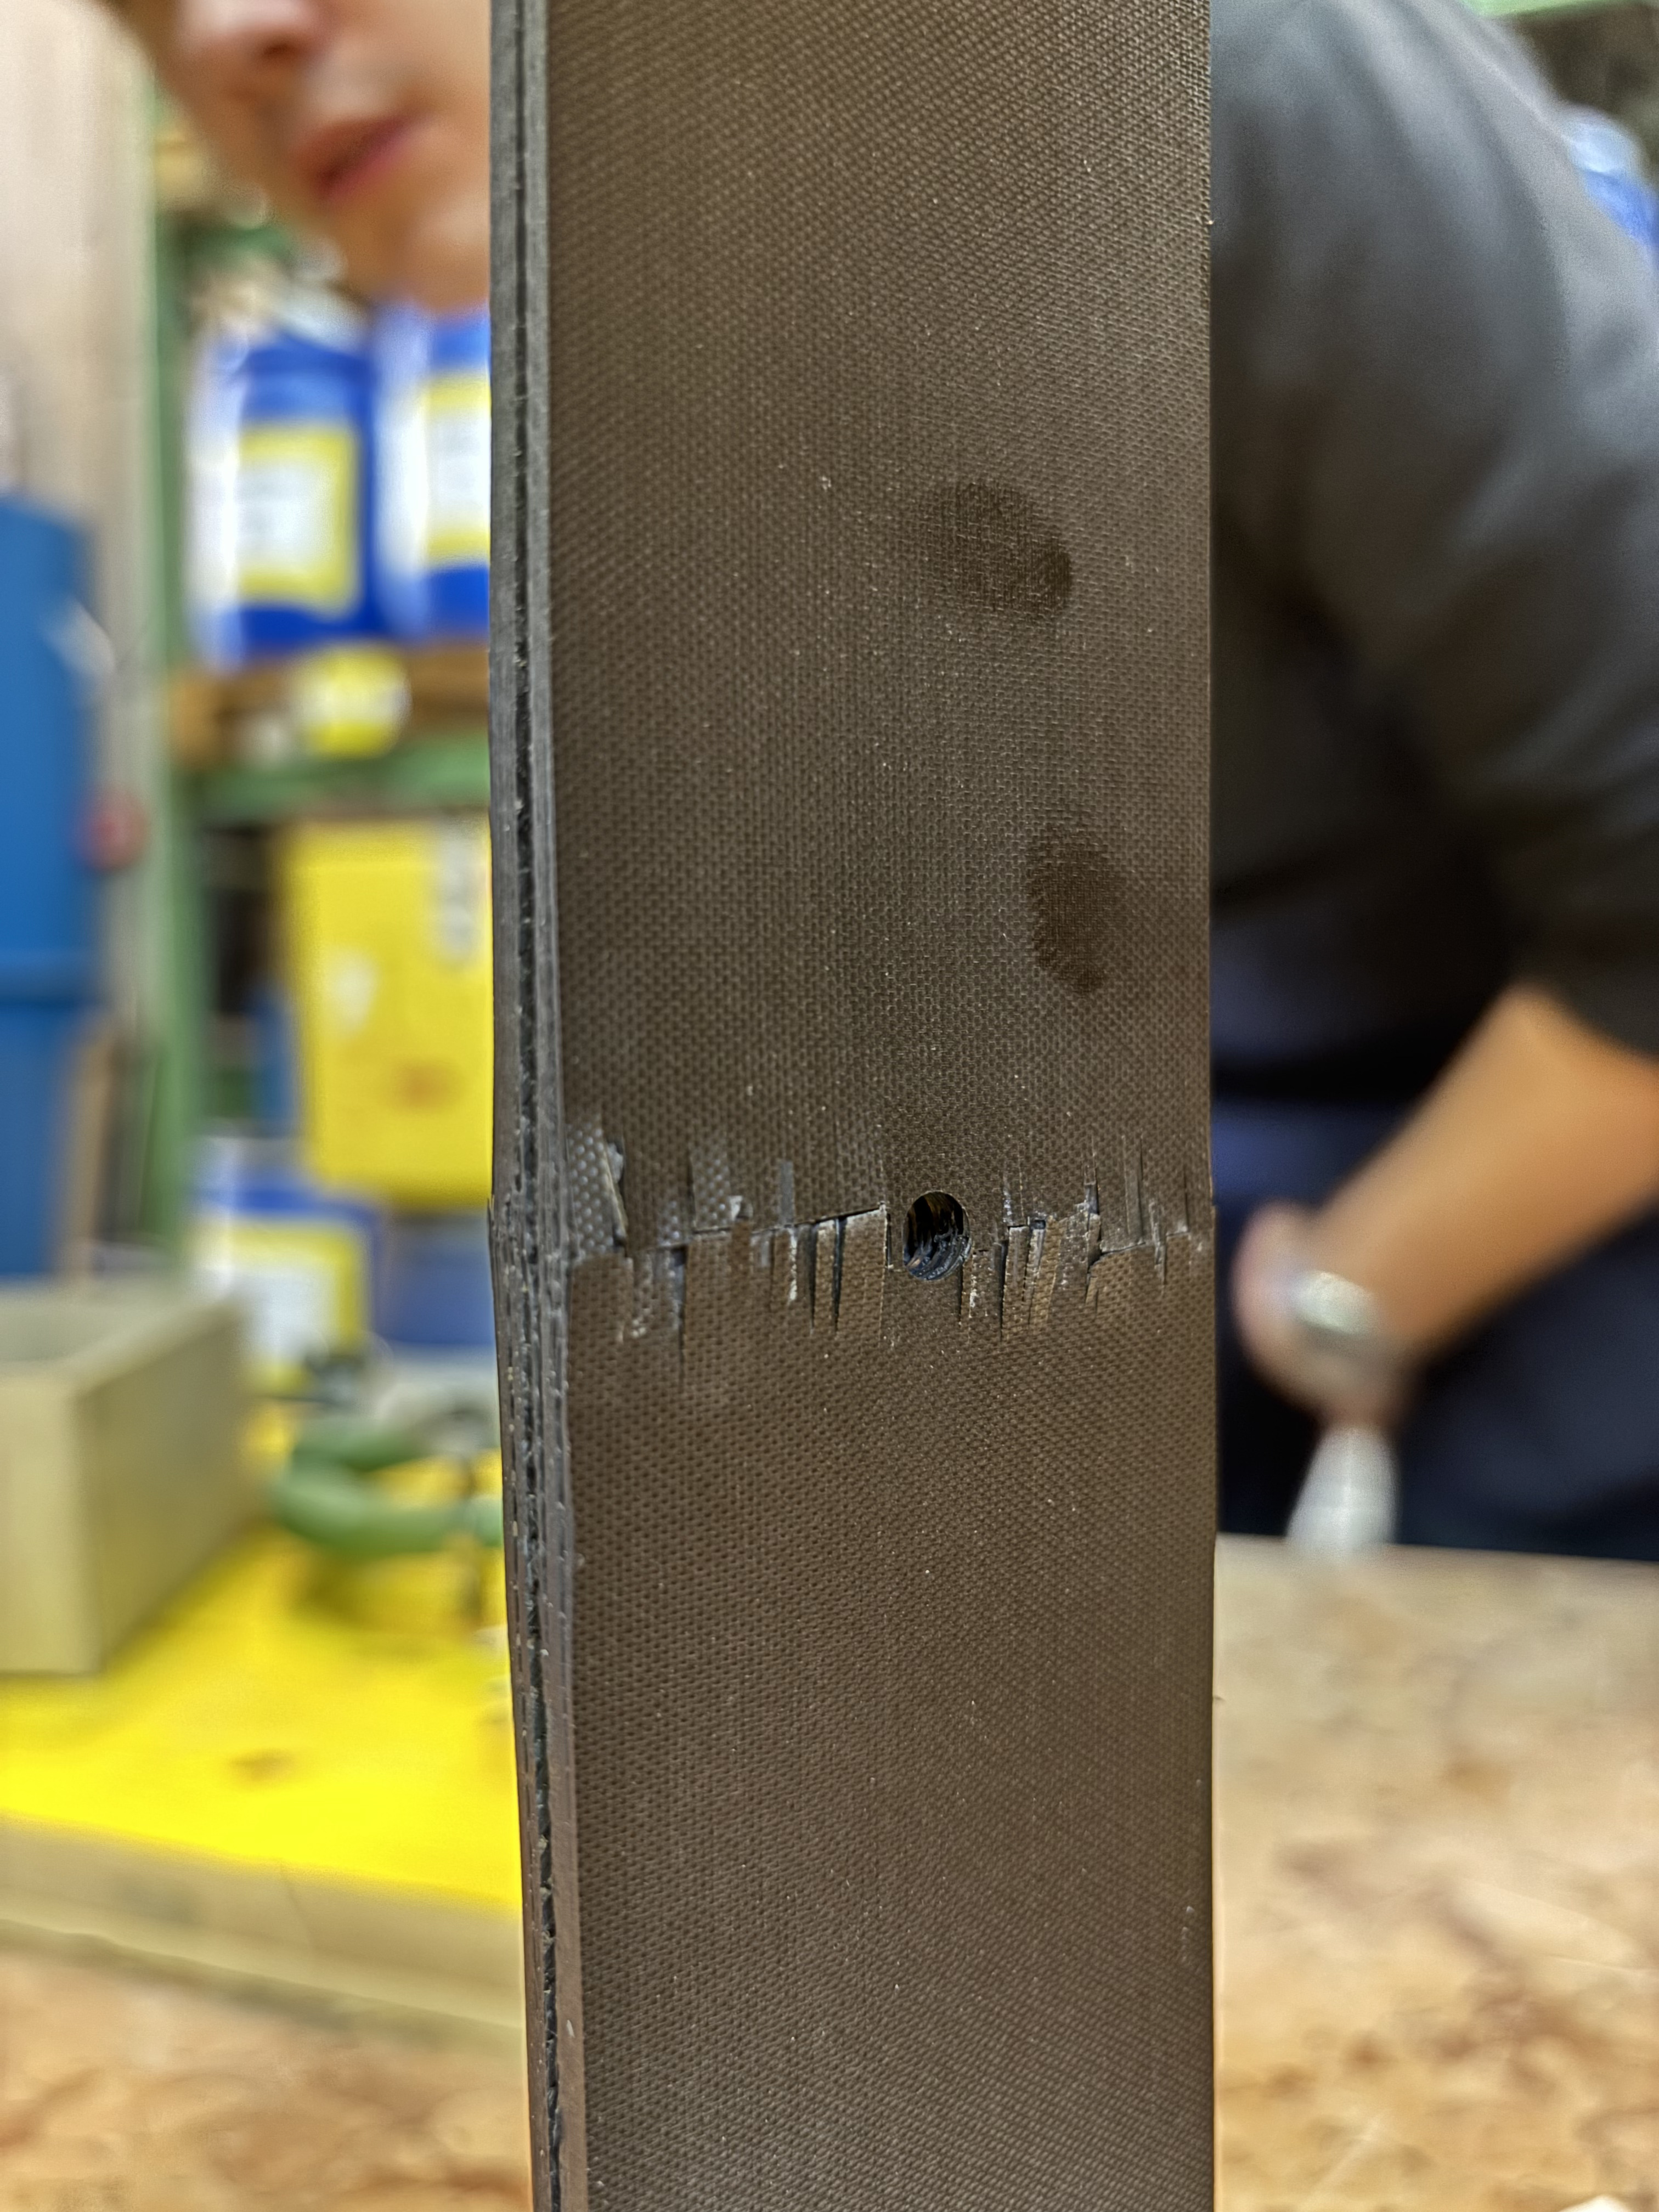
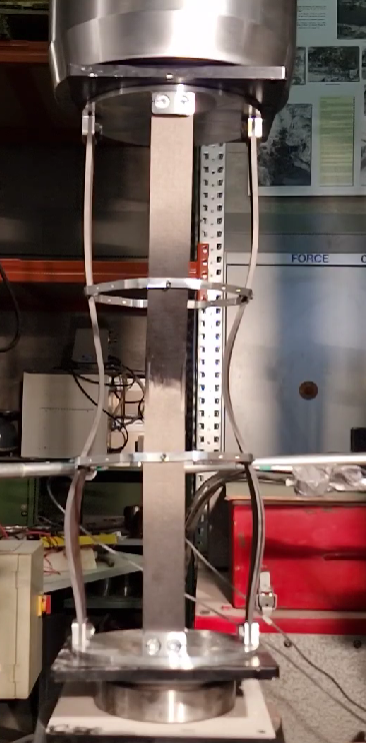
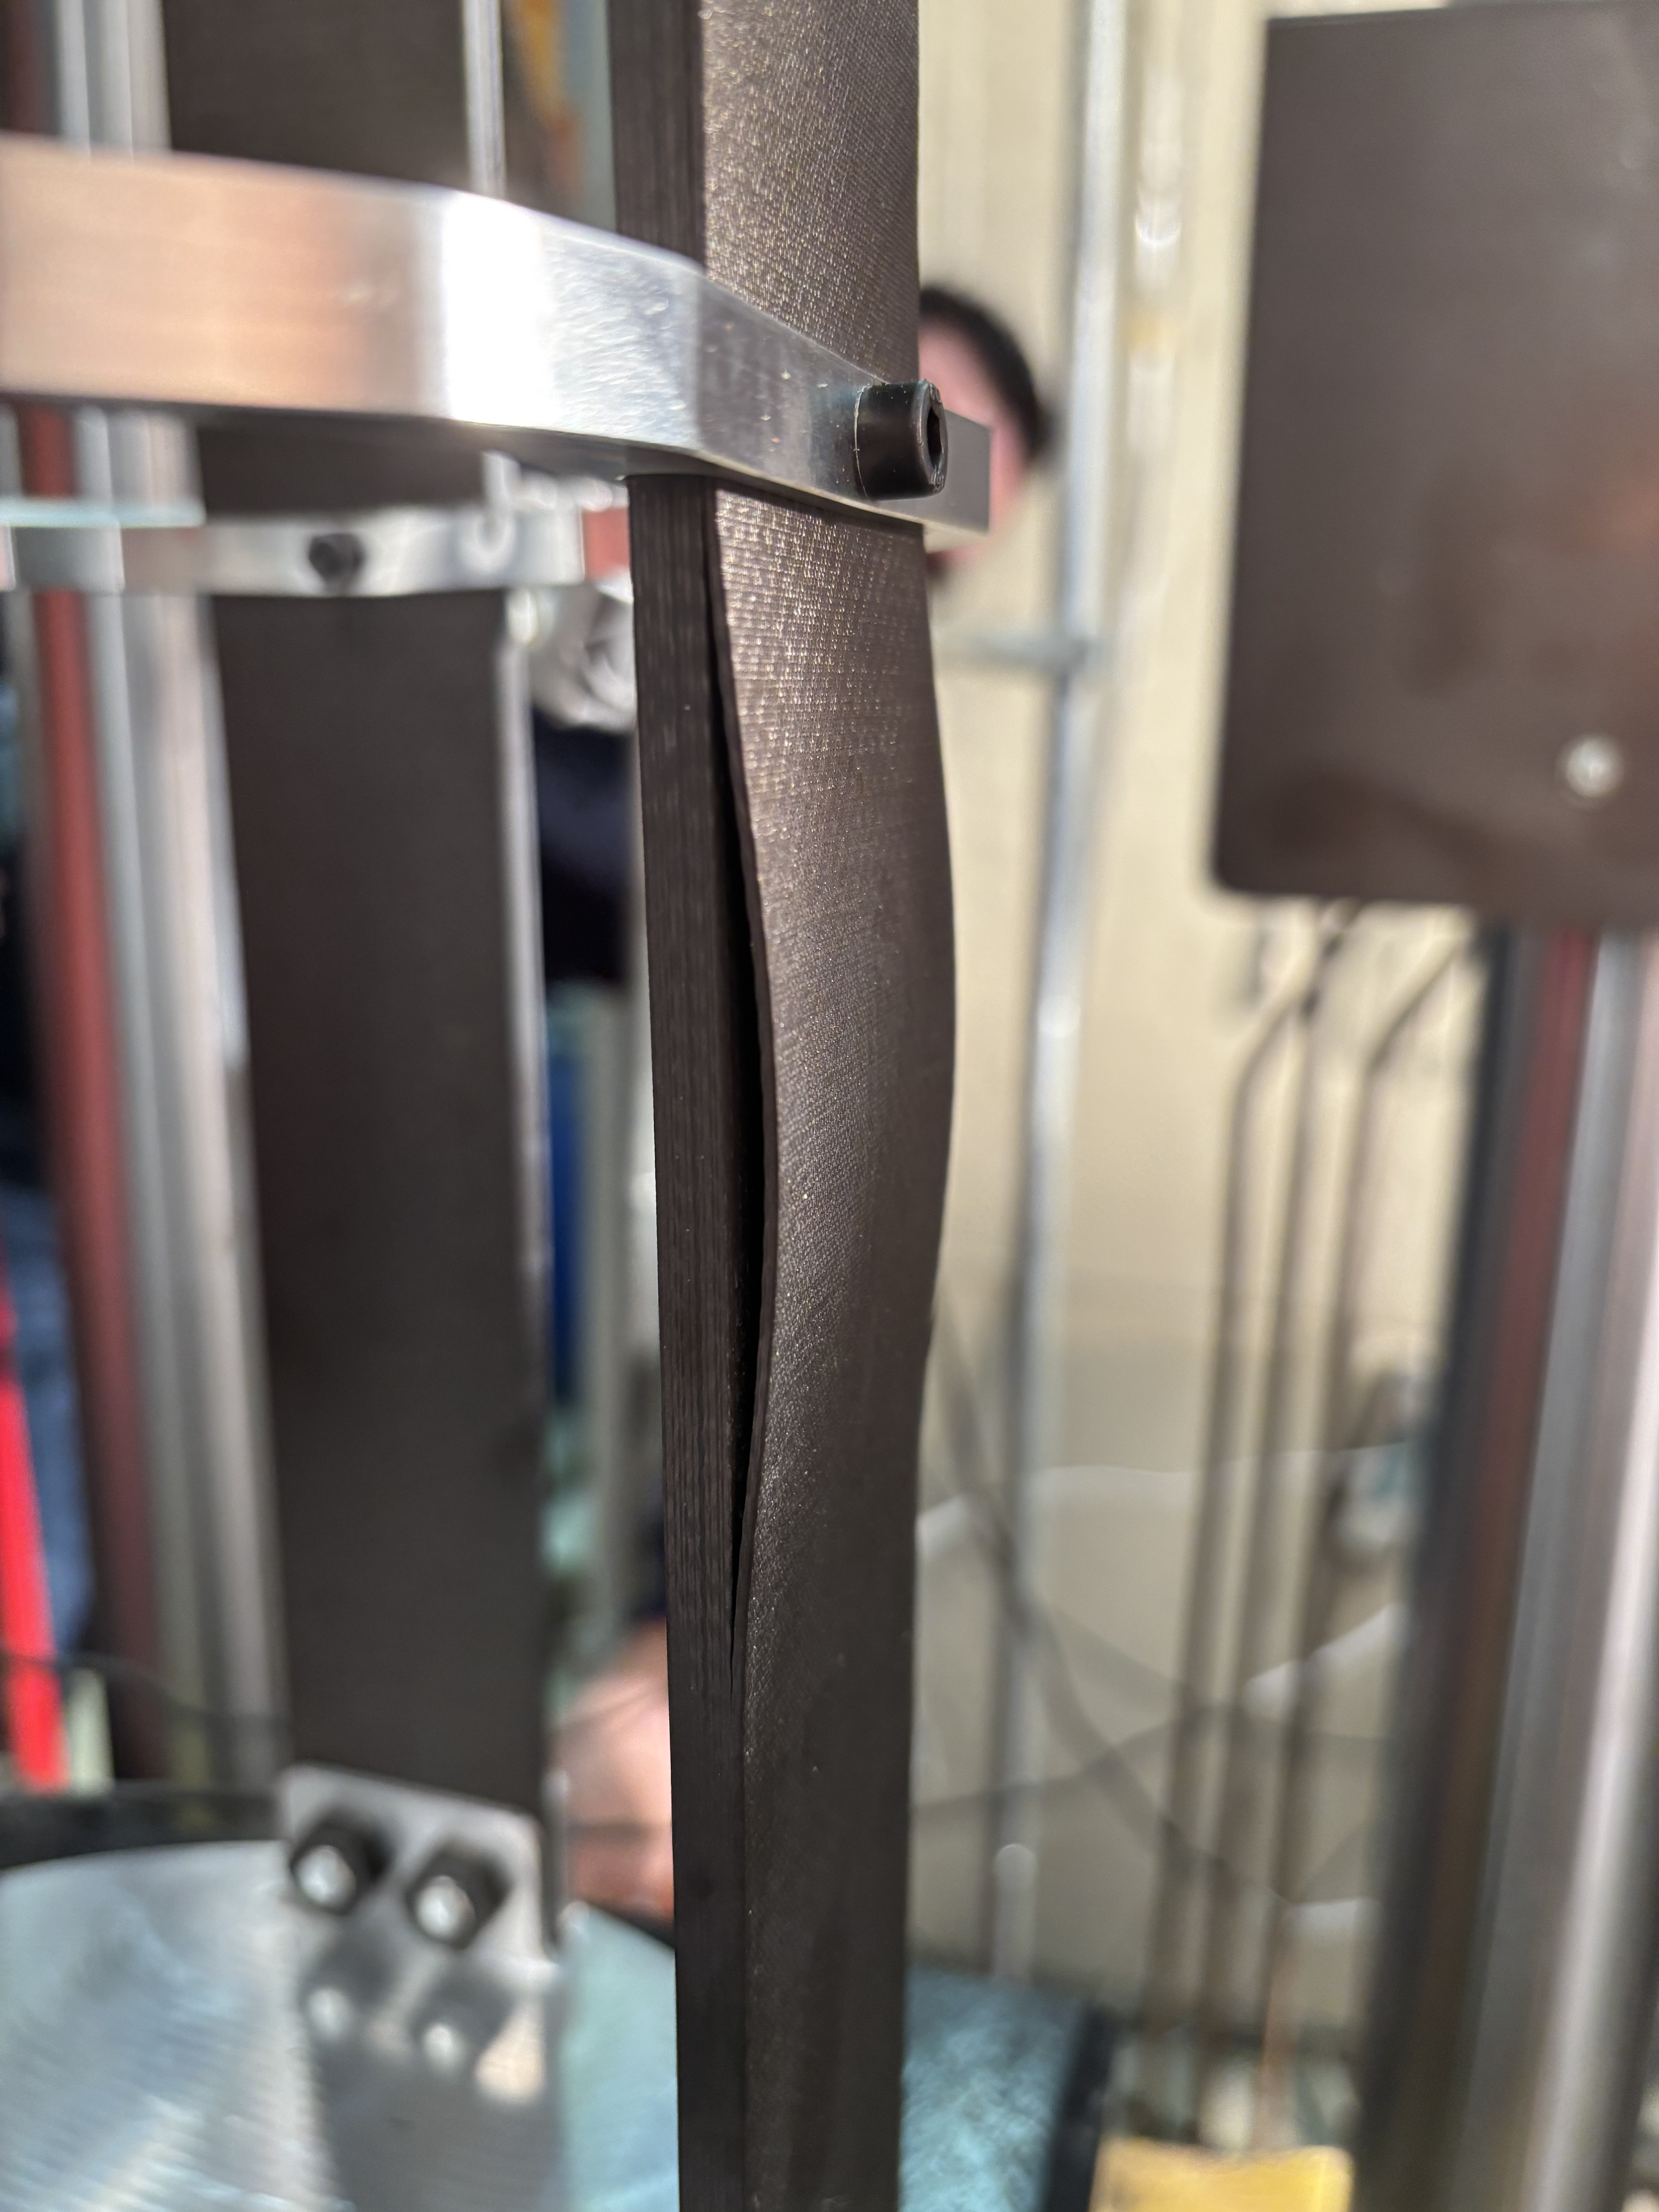
As predicted by the simulations, the rods broke before the anti-buckling rings. However, one of the fractures observed on the rod when viewed from the front does not match the expected fracture type. A fracture similar to the one observed in the module without the ABR was anticipated, specifically a horizontal fracture at the center of the rod on the outer layers. The actual fracture, however, occurred along the junction of a splice. During the manufacturing of the carbon plate used to cut the rods, the woven layers were patched to cover the entire plate.
| |
| |
|
| Module front view after buckling occure | Delamination of the left rod |
|---|
| |
| |
|
| Fracture at the joint of the outer layers of the rods | Fracture side view with also delamination |
|---|
| |
| |
|
| Delamination of the front rod under the lower ABR | Crack on the lower ABR |
|---|
| |
| |
|
| Delamination of the right rod between the two ABRs | Delamination of the right rod under the lower ABR |
|---|
¶ Pass Fail/Criteria
| Criteria | Pass/Fail ? |
|---|---|
| The failure load is at least twice the flight load (15 [kN]) | Pass |
| The error between the breaking load and the buckling load of the simulation is less than 10% | Pass |
The module has successfully passed the test
¶ Requirements which were verified
- 2024_C_SE_ST_INTERNAL-STRUCTURE_REQ_05
Axial compression
The internal structure shall withstand 15 [kN] of compression without failure.
- 2024_C_SE_ST_INTERNAL-STRUCTURE_REQ_06
Buckling
The internal structure shall withstand 15 [kN] of compression without loss of stability (buckling).
¶ Conclusion
The internal structure has been thoroughly tested and validated for loads equivalent to a 30 km flight. This project has considerably improved our understanding of the system's performance, highlighting its limitations. Having tested this structure to destruction has enabled us to prove that our simulations are close to reality, and to identify its weak points. These tests also enabled us to validate the design of the anti-buckling ring, a part that was difficult to design due to a lack of knowledge of the loads applied to it.
These tests also allowed us to determine the safety factor for the flight load before rupture. For Firehorn I, which is designed to reach an altitude of 9 [km], the flight loads are half as high, effectively doubling the safety factors. Such a safety margin suggests that we could remove all the anti-buckling rings (ABRs) from the modules and still have a structure that can withstand the flight loads. However, it was decided to keep the ABRs in the avionics bay and pressurized bay, as they serve as attachment points for other subsystems such as avionics and propulsion. Without the ABRs, these subsystems would need to add additional components to secure themselves to the structure, and the overall mass would not be lighter than if the ABRs were kept. Therefore, maintaining the ABRs allows us to preserve a high safety factor for the loads, provide an interface for the various subsystems, and reduce the mass of the interface components.