¶ Goal(s) of the study
These simulations were performed to assess the structural integrity of the flight version of the Firehorn I launch vehicle propellant tanks. In particular, the goal was to determine the stresses in the weld area in order to compare with expected post-weld material properties.
¶ 215100_Tank_6082_F
¶ Geometry
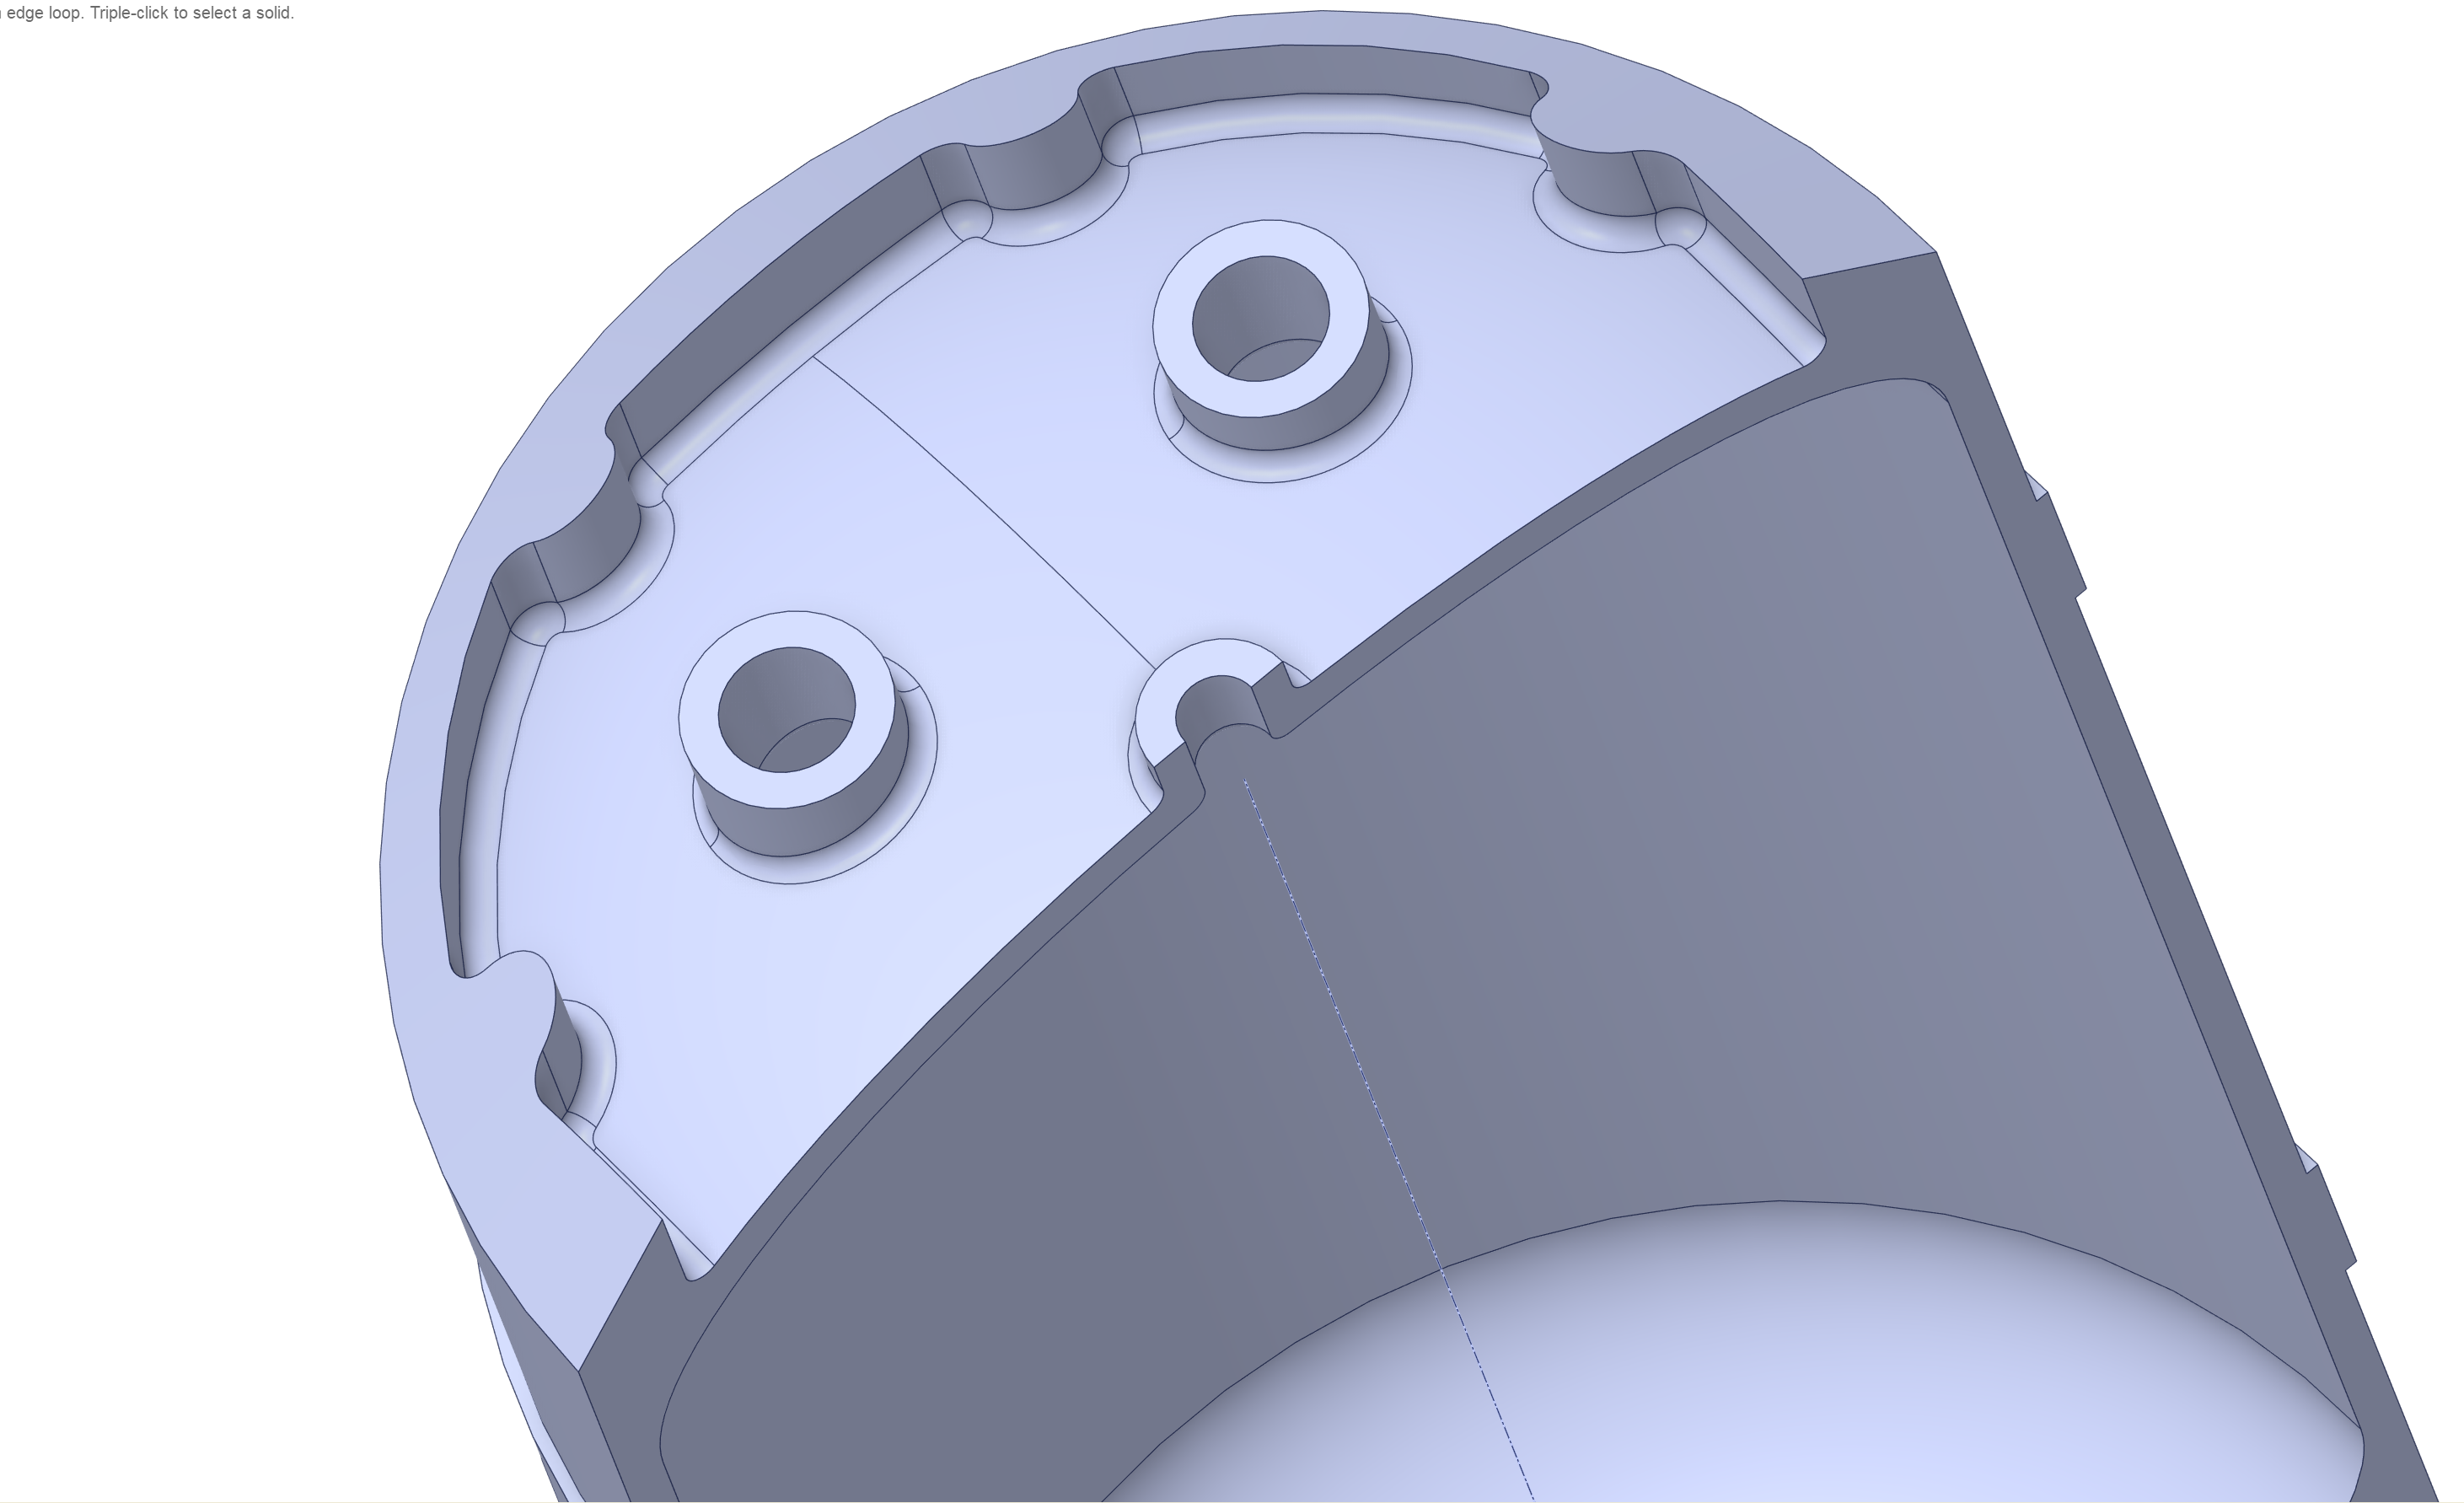
The tanks are made out of 2 machined caps that are welded to a cylindrical section. The caps contain connections for plumbing as well as holes for the screws that allow the structure couplers to be fixed to them.
¶ Function
The propellant tanks have 3 main functions:
- store propellants
- withstand internal pressure
- withstand flight loads
¶ Material
These tanks are made of 6082 aluminum in the T6 state. Near the weld area, due to the metal fusion, the tanks are closer to a T0 state and experience loss of mechanical properties. The aluminum used for the caps was bought from Thyssenkrupp, and the aluminum used for the main cylindrical body was bought from WMH Group Germany.
According to these suppliers, the following mechanical properties can be expected:
¶ Load case
It was determined from experience with the early Firehorn generation of propellant tanks that the critical structural factor is the internal pressure, and that flight loads are comparatively negligible. Therefore, the requirements for this propellant tank only lists the internal pressure:
- 2024_C_SE_ST_TANK_REQ_09 Tank yield pressure
The tank shall not yield under an internal pressure of [90]bars for [30] minutes. - 2024_C_SE_ST_TANK_REQ_26 Tank burst pressure
The tank shall not burst under an internal pressure of [120]bars.
¶ Parts List
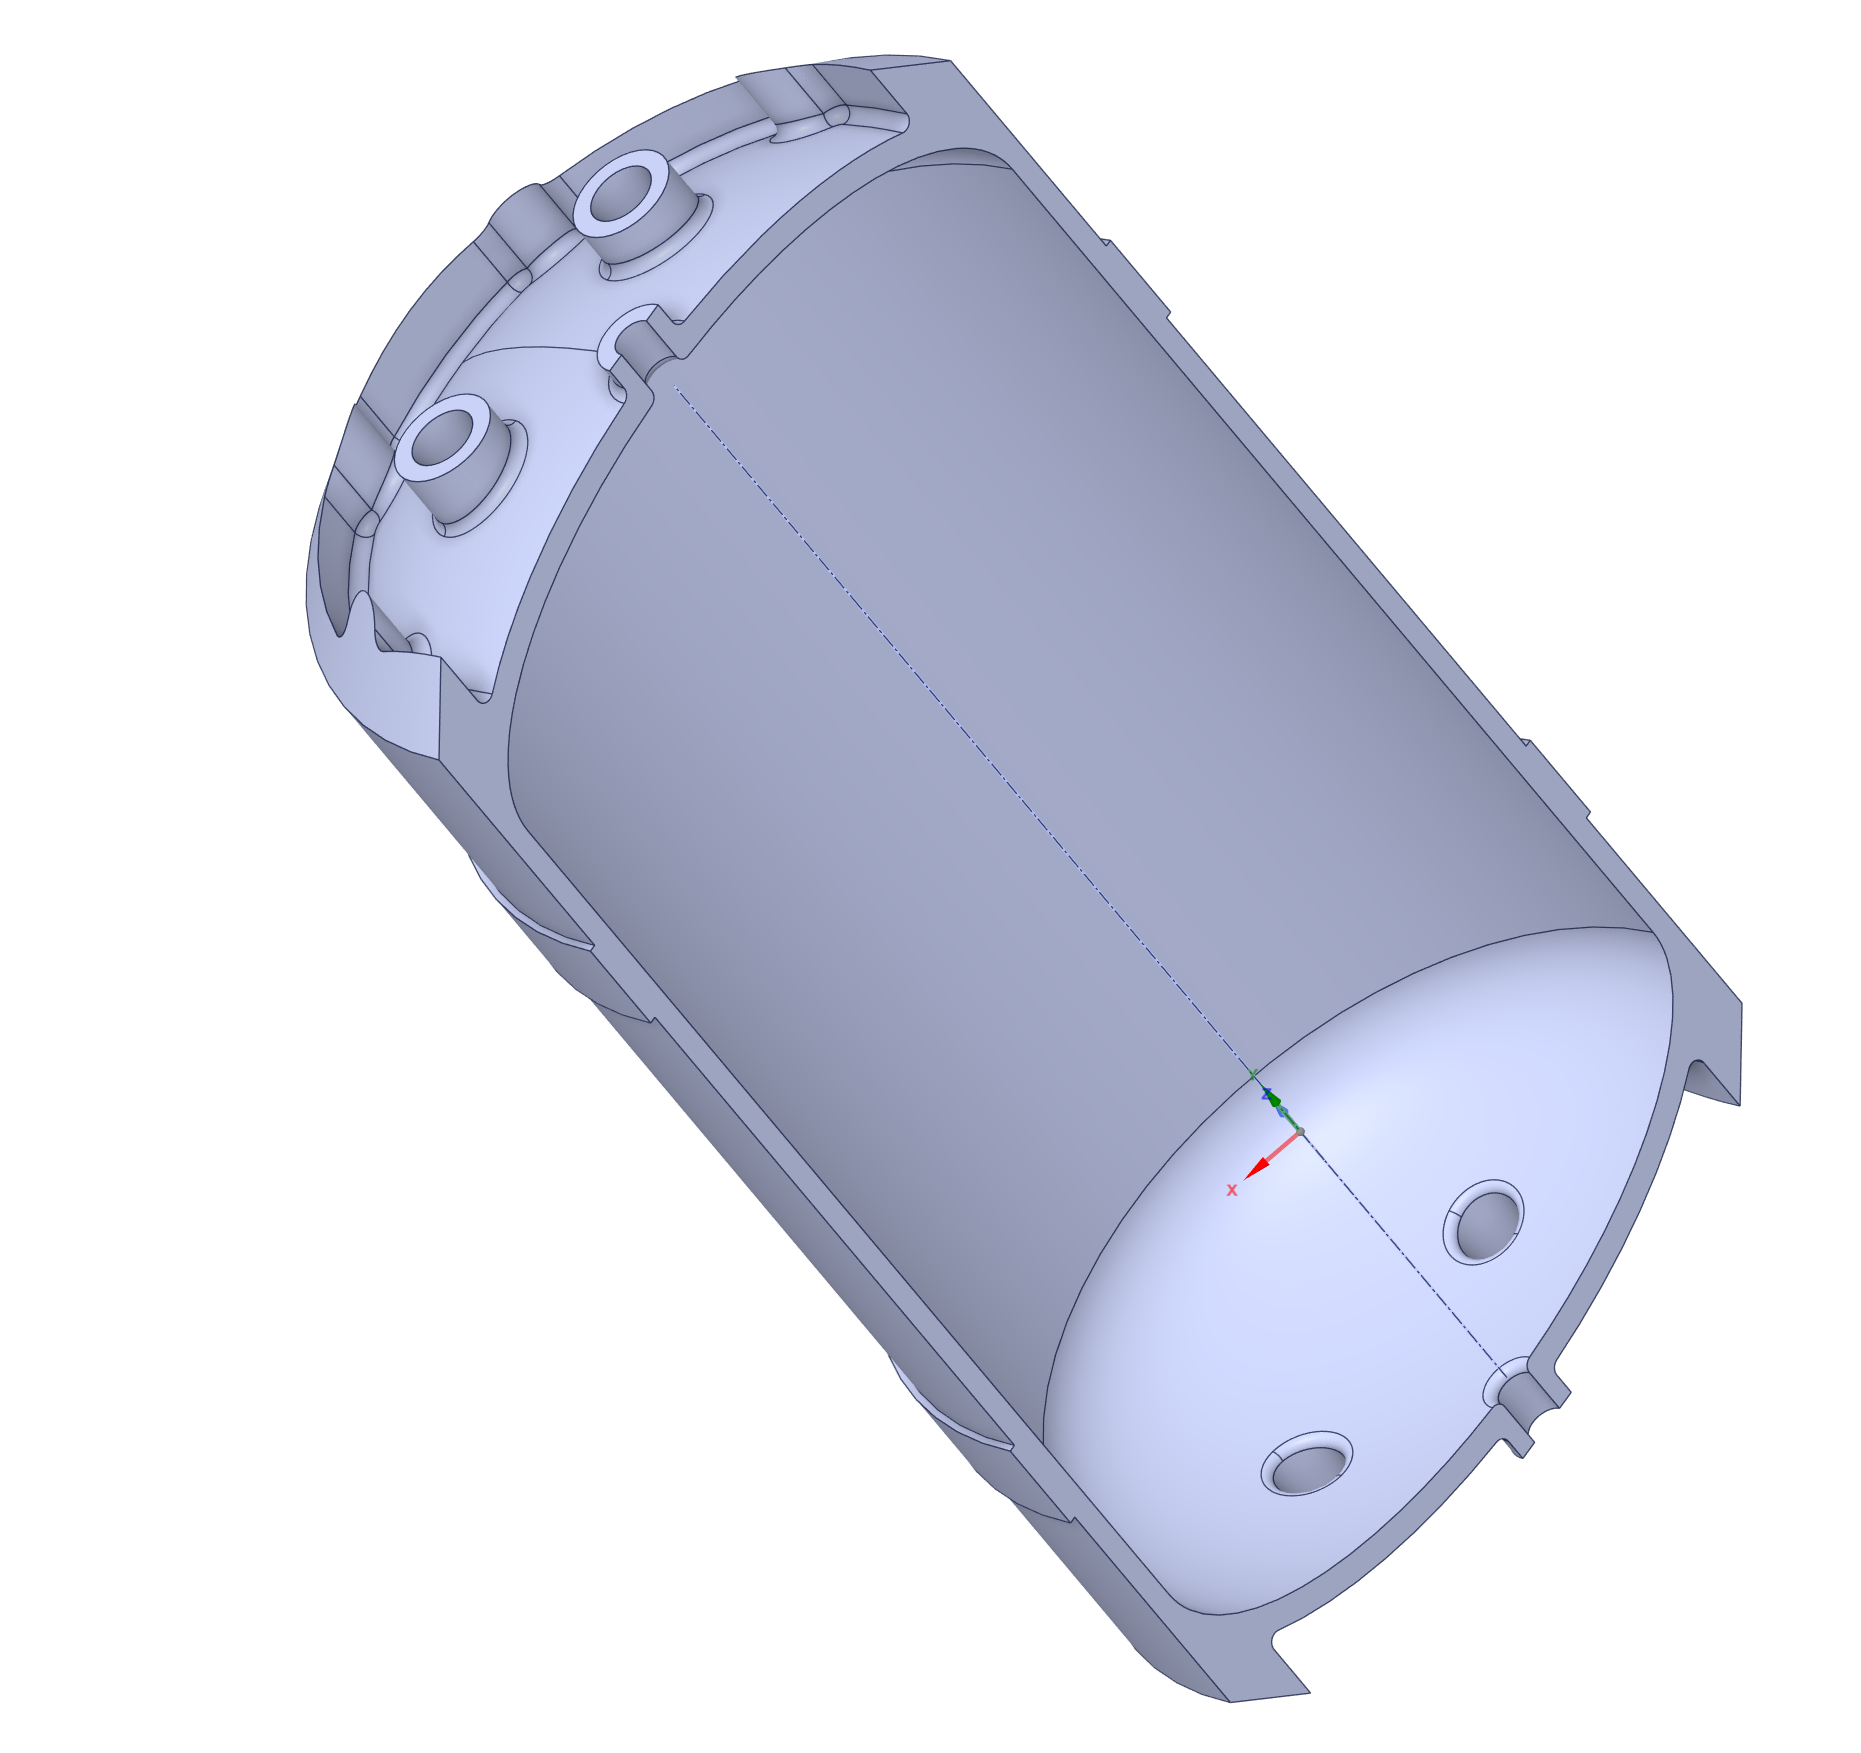
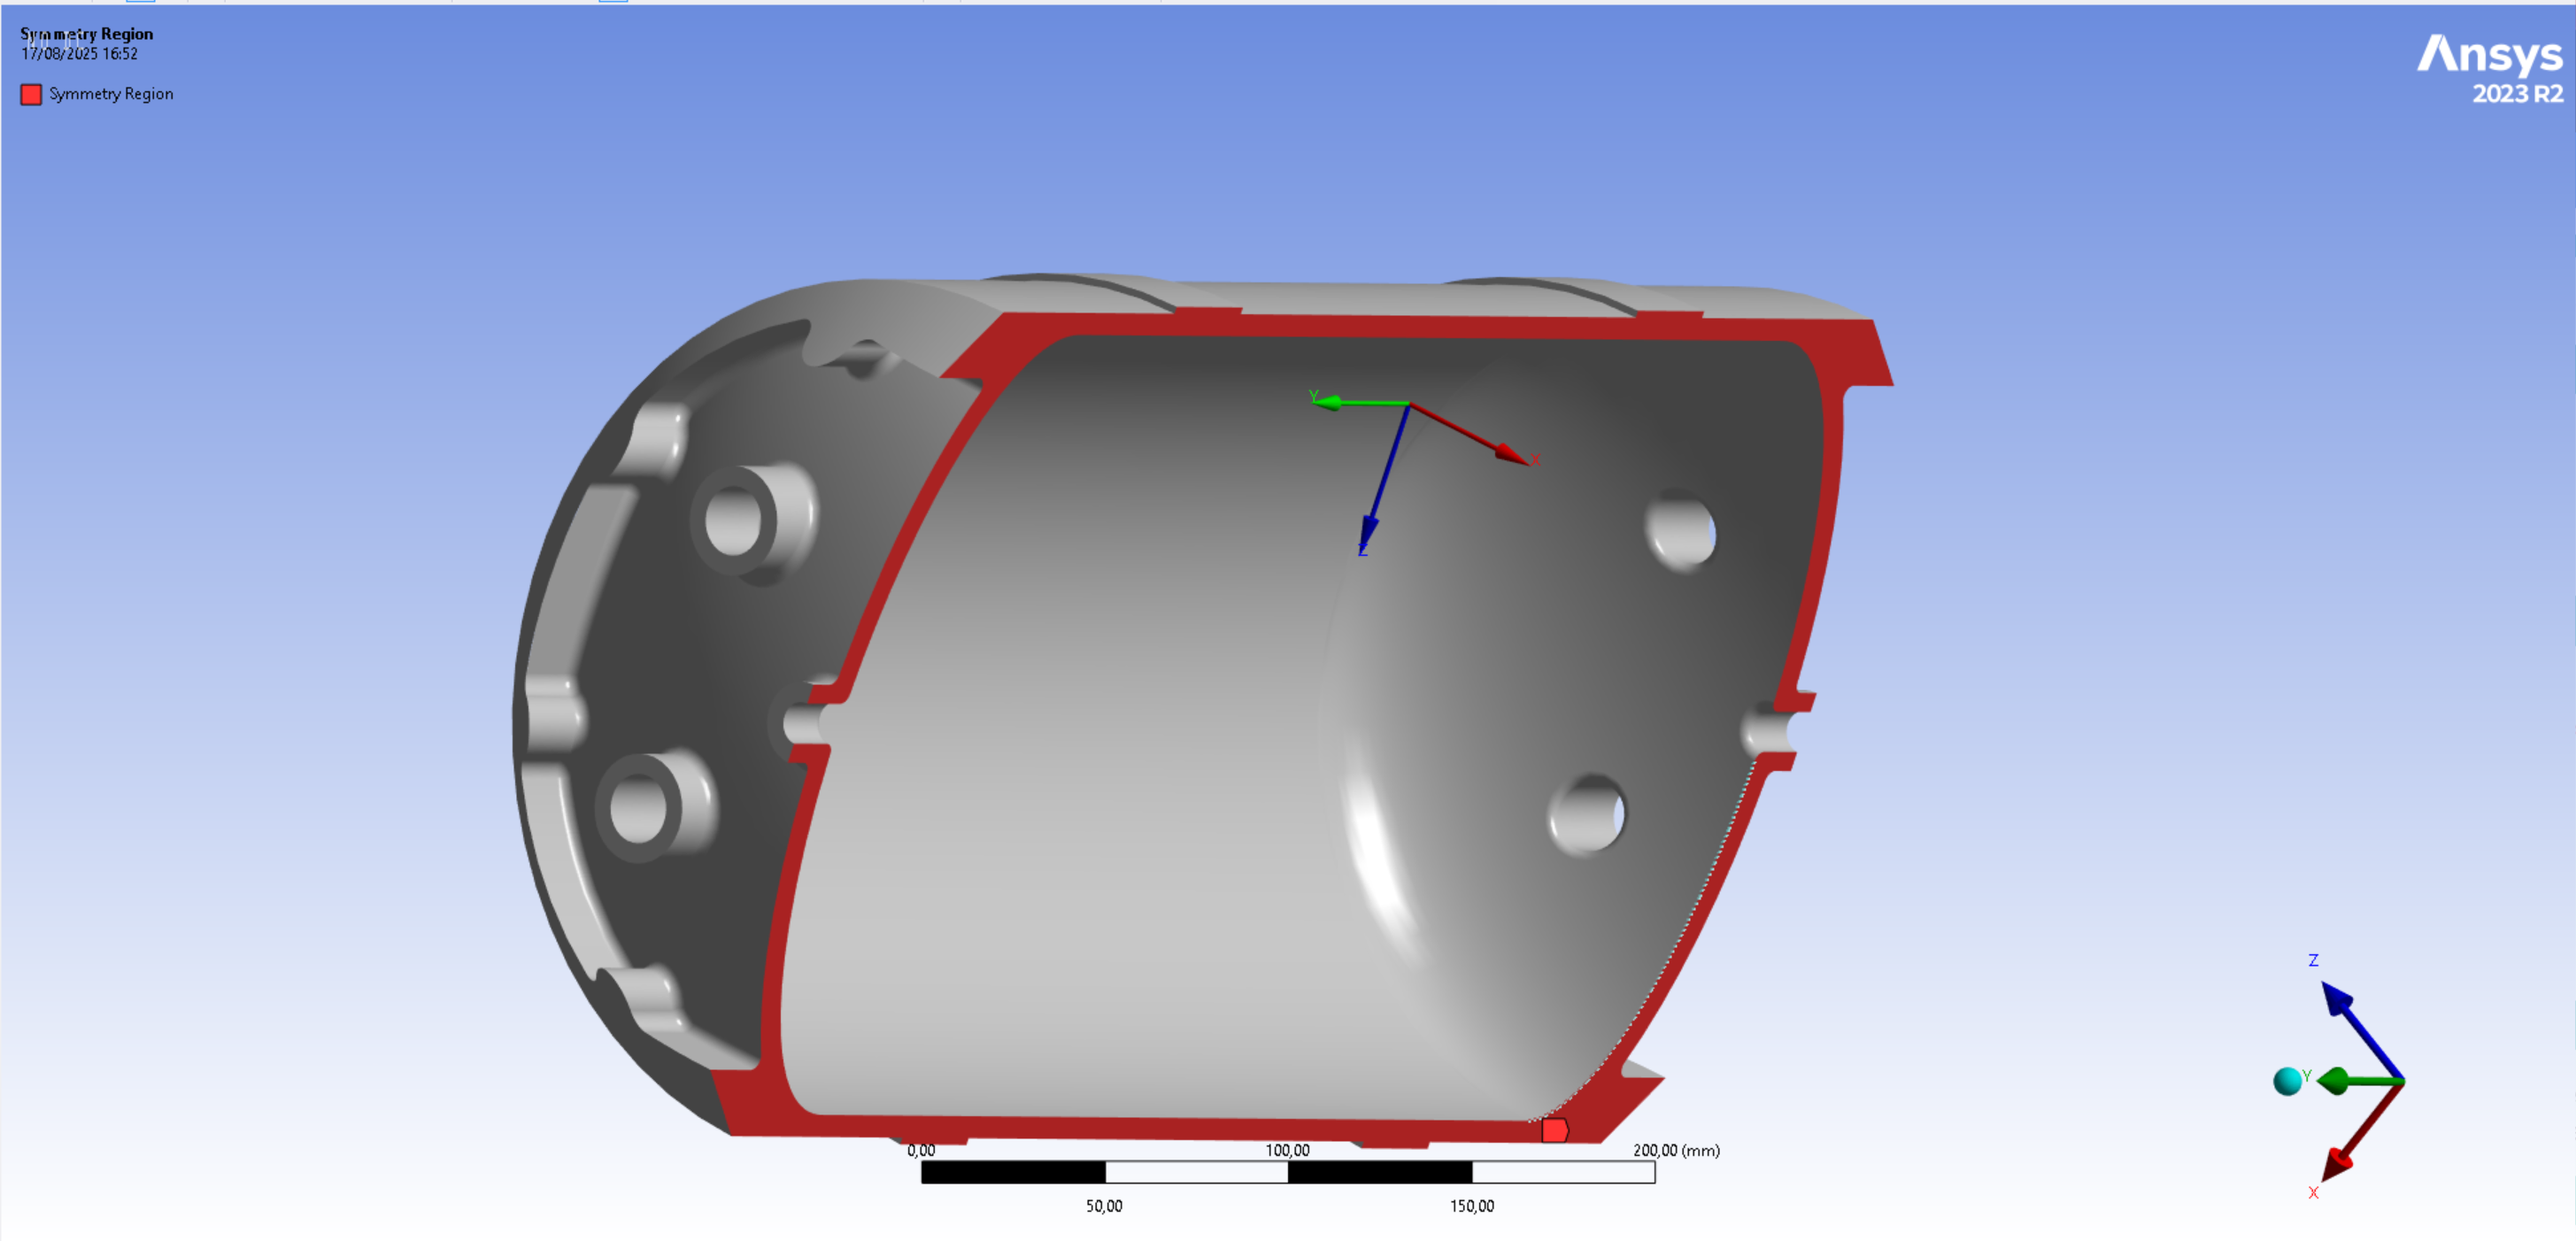
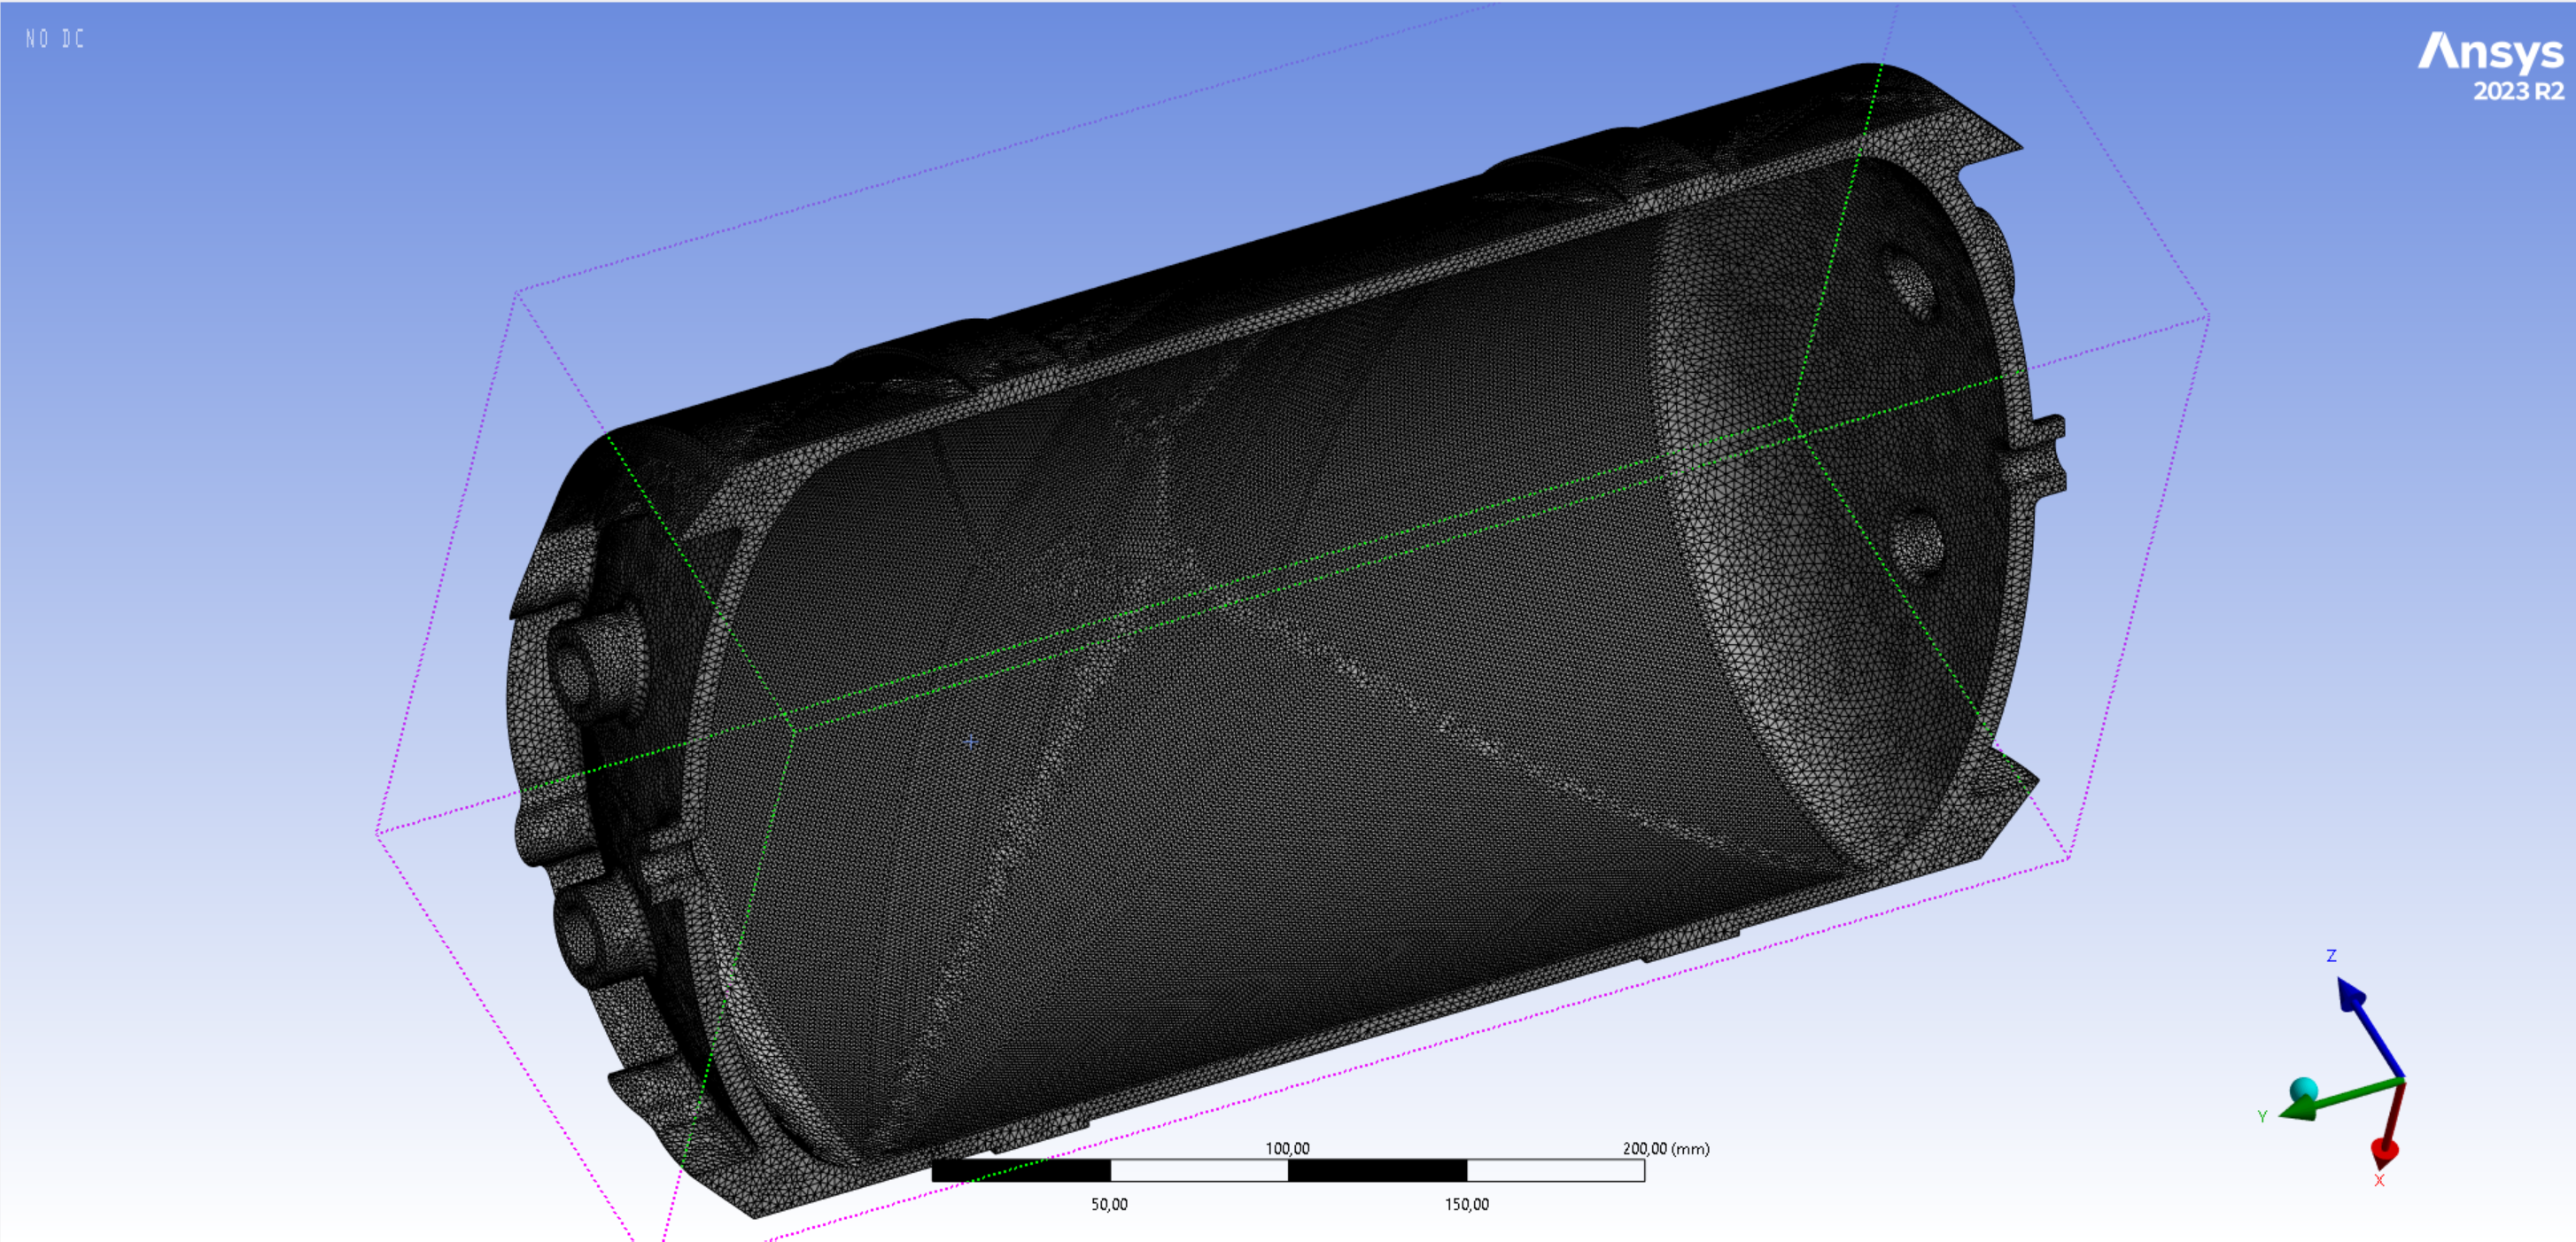
The flight tanks are composed of two elliptical caps and one cylindrical main section. These parts are combined in Spaceclaim in order to simulate have a single body. This is the simplest and most straightforward way to handle welds, although it isn't the most accurate. Nonetheless, it was determined that this is the appropriate method to use, considering the limited expertise of students in the association. The following image contains an overview of the assembly before it is welded together.
More information regarding the tank design can be found in the following documents:
 2025_C_ST_TANKS_DDF
 Florent Piton
- 2025_C_ST_TANKS-6082T6_MAP
Florent Piton
¶ Finite Element Analysis
¶ Software
This FEA analysis was performed with ANSYS Mechanical. The CAD of the different parts was designed using Solidworks. These CADs were later simplified in Spaceclaim.
¶ Type of simulation
Two different simulations were ran, one for each requirement. Both simulations were static structural simulations. For both simulations, no types of nonlinearities are modelled.
¶ Inputs
The following set of units was used in mechanical: mm-kg-N-s-mV-mA-degrees-rad/s-celsius
The geometry was simplified for the simulations in the 2 following ways:
- the caps were simplified by removing unnecessary details
- the entire tank was split in half along one symmetry plane
For the caps simplifcation, all thread holes were plugged. Additionally, the pouches that were created for mass savings were also filled.
This was done because these geometries won't affect the tank's ability to withstand the internal pressure, and removing them greatly reduced the number of mesh elements.
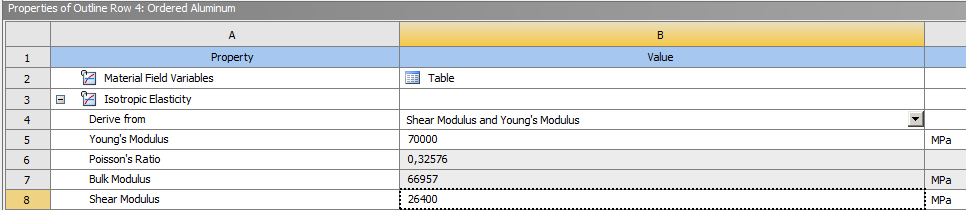
The material properties were modelled by adding a new custom material with isotropic elasticity properties. The values given by the supplier were added. Since no material nonlinearities are modelled, only the Young's Modulus and Shear Modulus are needed. The given elastic limit of 240[MPa] is however used when the results are assesses, in order to determine which regions have entered plasticity.
The simulations are time-invariant. Although the requirements specify the duration of 30min, modelling burst through plasticity under internal pressure was determined to be far too complex. Instead, it was determined that performing a static simulation to verify that no plasticity occurs in the weld geometry is the better approach.
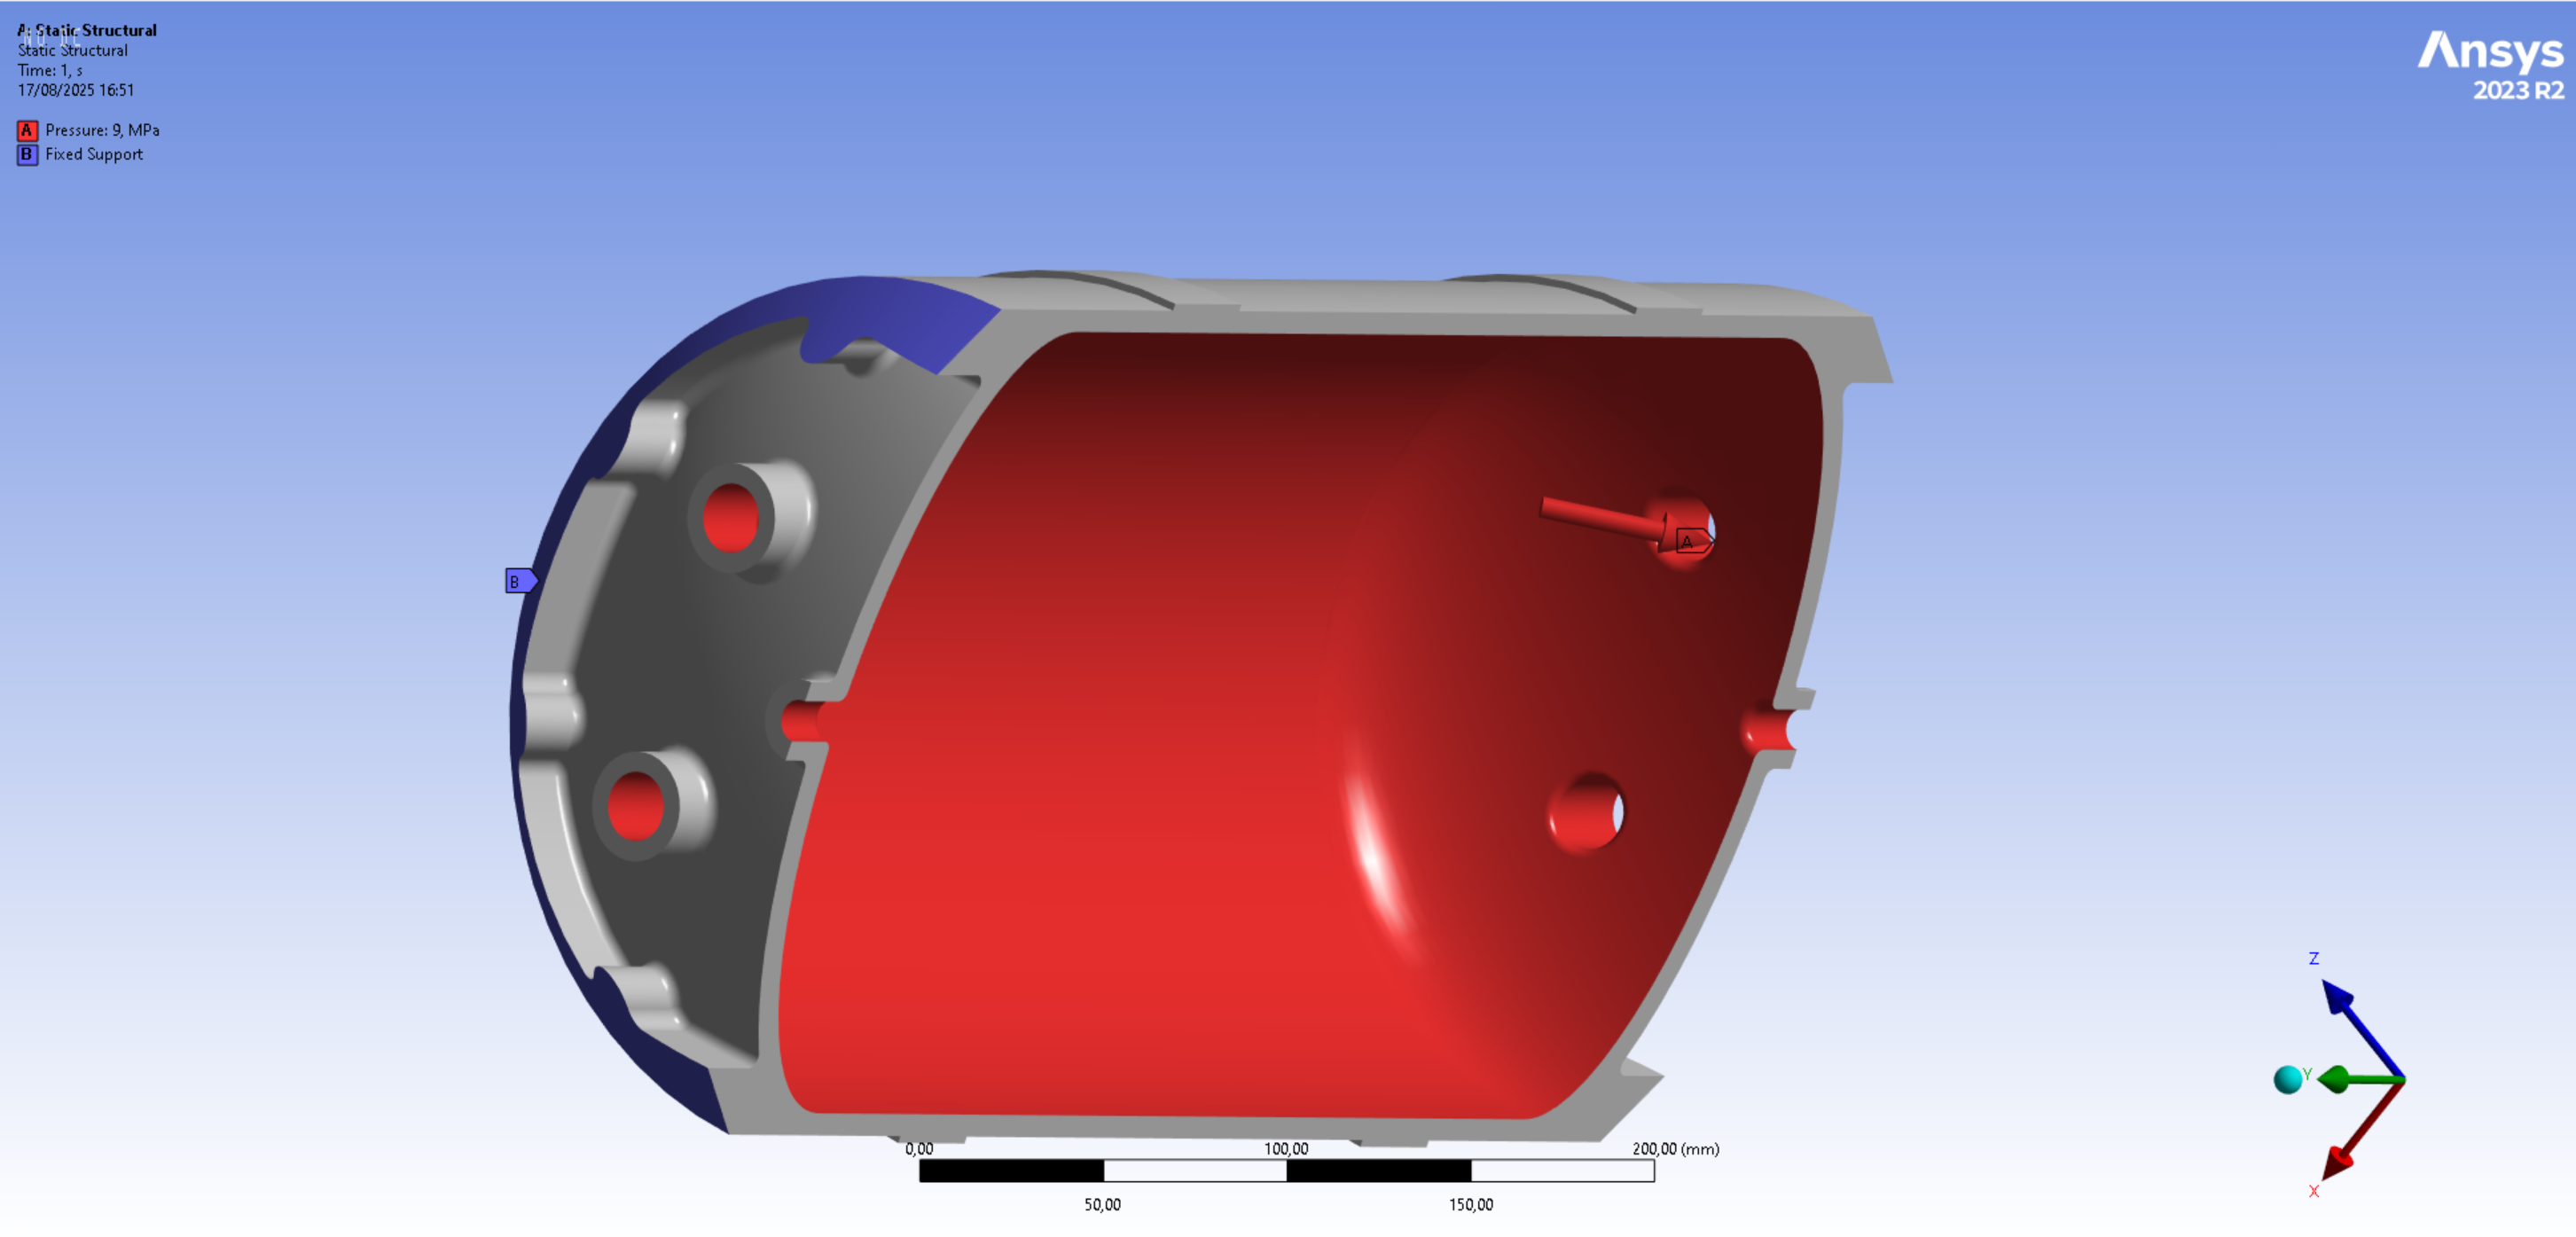
An pressure boundary condition is applied on the entire internal surface. One of the coupler surfaces is clamped by applying a fixed support condition to it.
In flight, there would also be a force to apply to the other coupler. This would however result in less stress in the tank as this compressive force would "help" the tank to contain the internal pressure. Therefore, the worst case corresponds to the hydrostatic qualification test were no external force is applied to the tank.
One could also argue that applying a fixed condition to the coupler is overcontraining compared to the real-life hydrostatic test. Therefore, results are only considered on the half of the tank that is opposite to the fixed support condition. Simulations were also ran with weak springs activated instead of using the fixed support, and it was observed that the simulation results were similar.
|:--- :---:---
| Real case - Flight | Real case - Hydrostatic Test | Model |
| Both couplers clamped, w. compressive force | No external force or displacement constraint | One coupler clamped, results considered on other half |
No nonlinear settings were used in this analysis. All analysis settings are left by default.
¶ Mesh
The mesh creation, refinement and independency test were all performed on the 90[bar] load case.
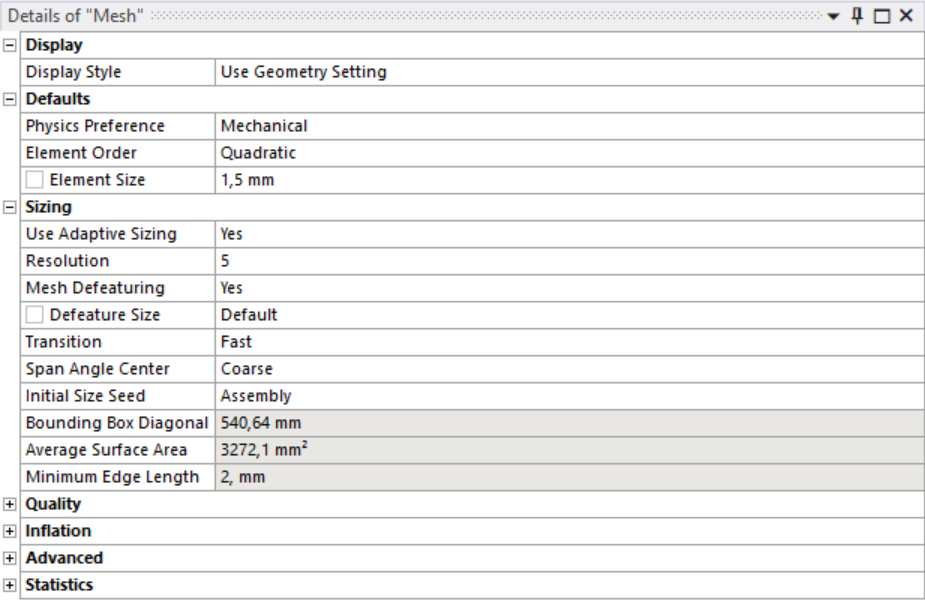
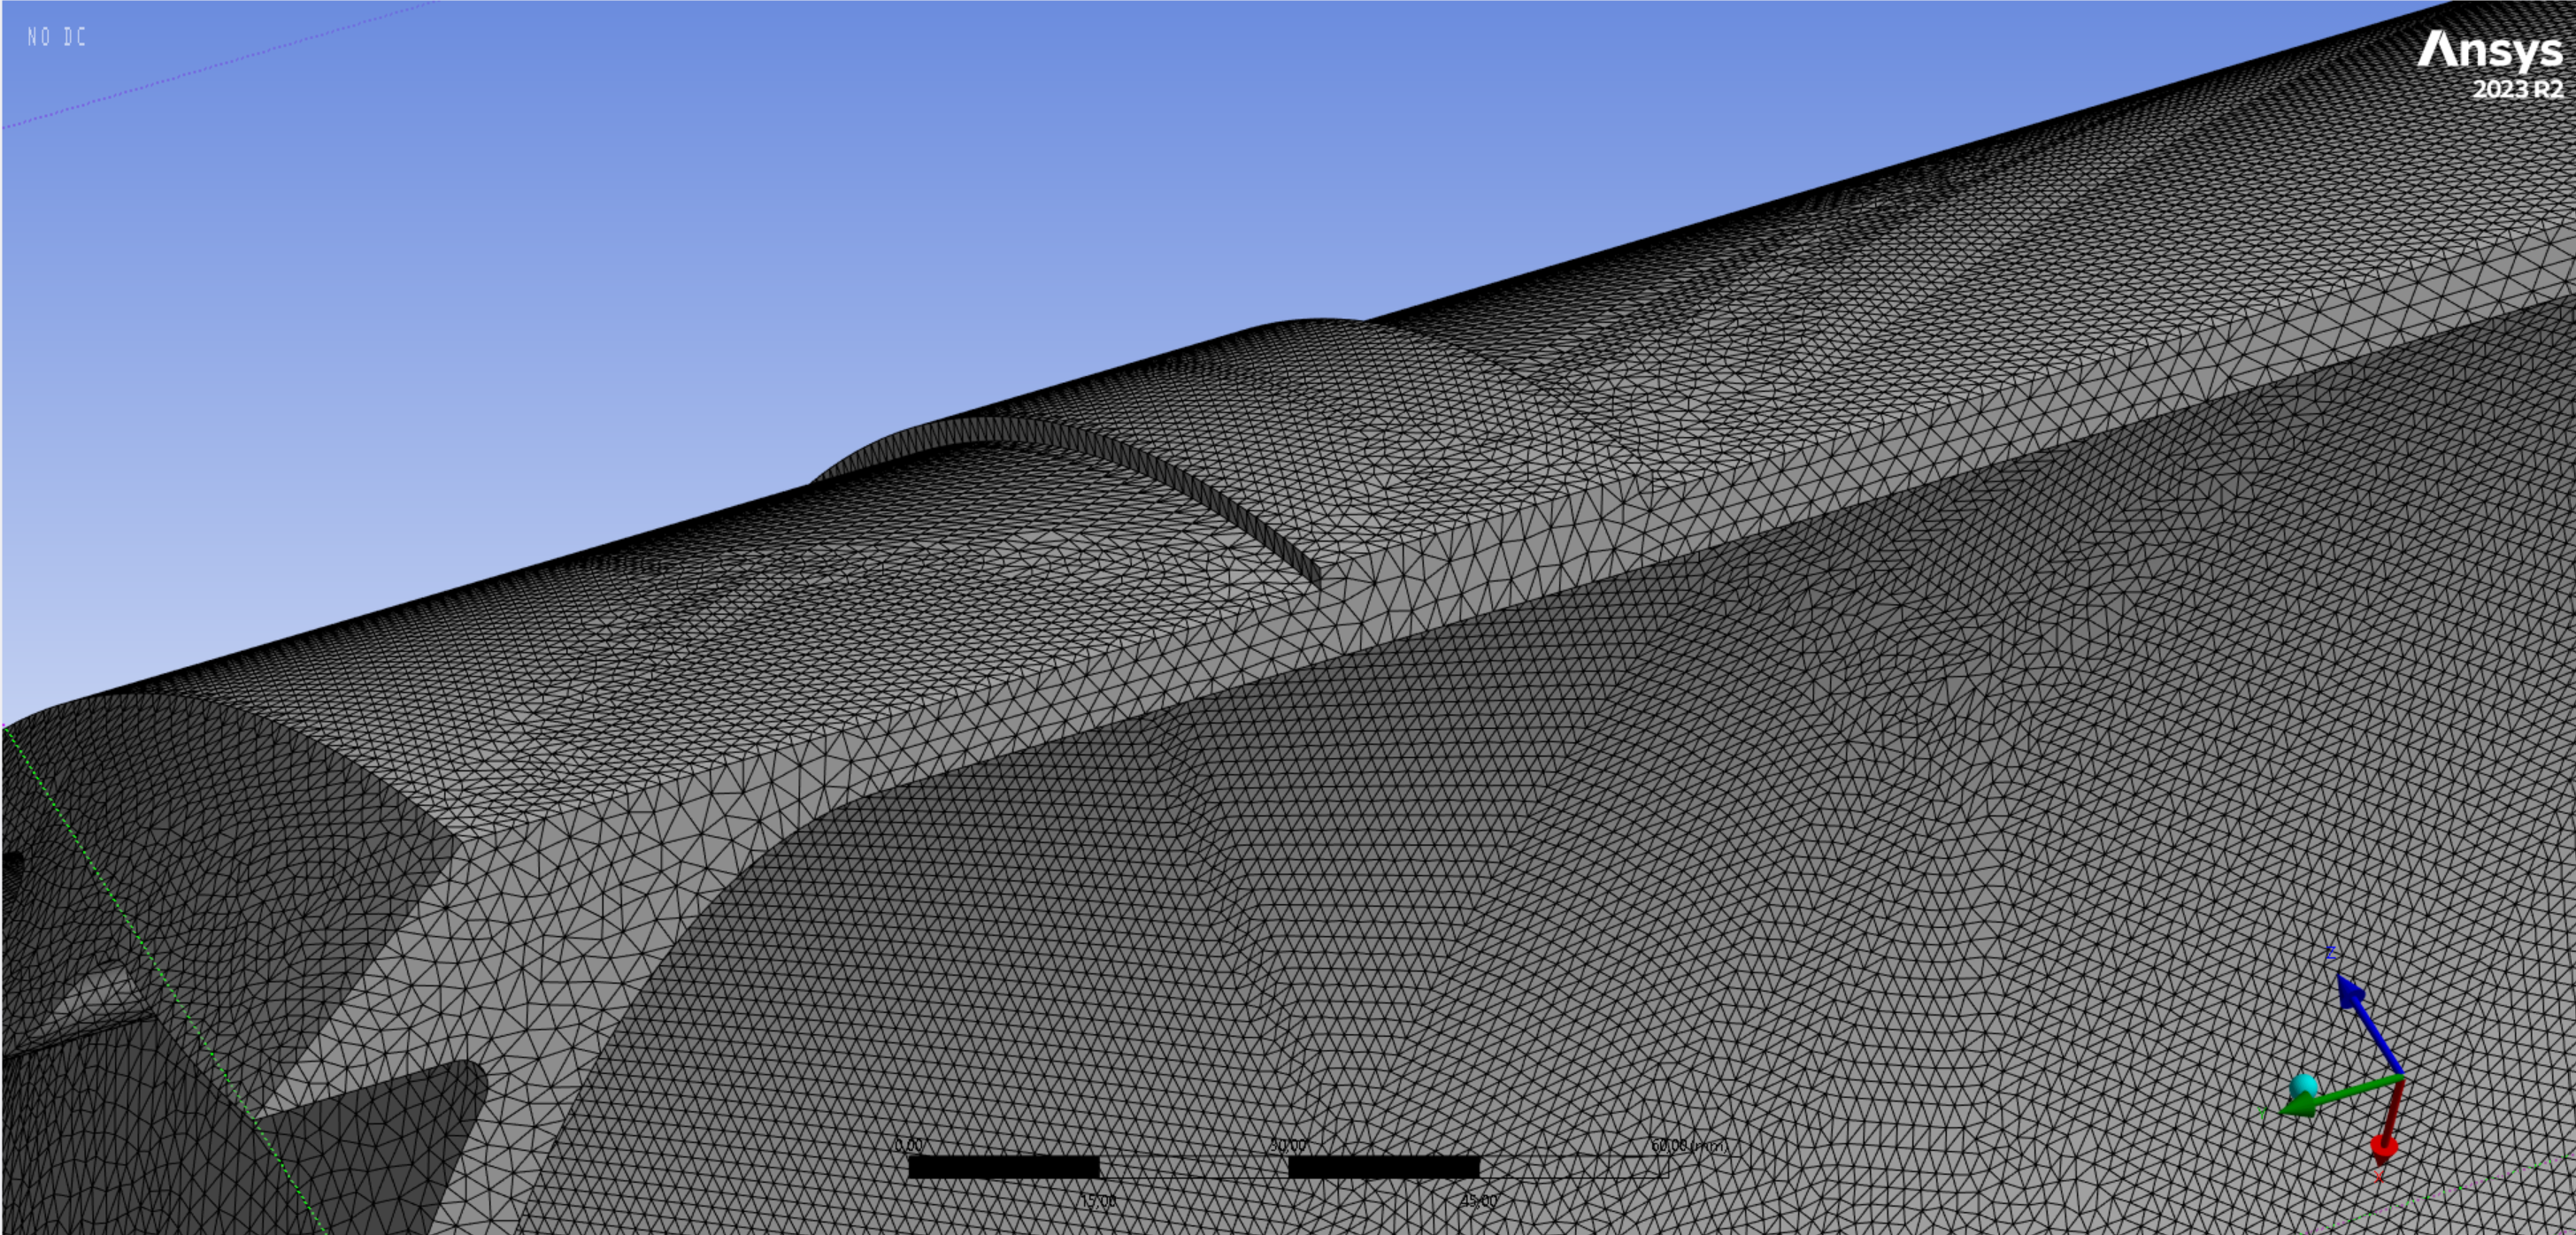
Only solid Tet10 2nd order elements were used. The following global settings were used to generate the mesh:
No refinement was applied, and no method or other objects were used to generate the mesh other than the global settings.
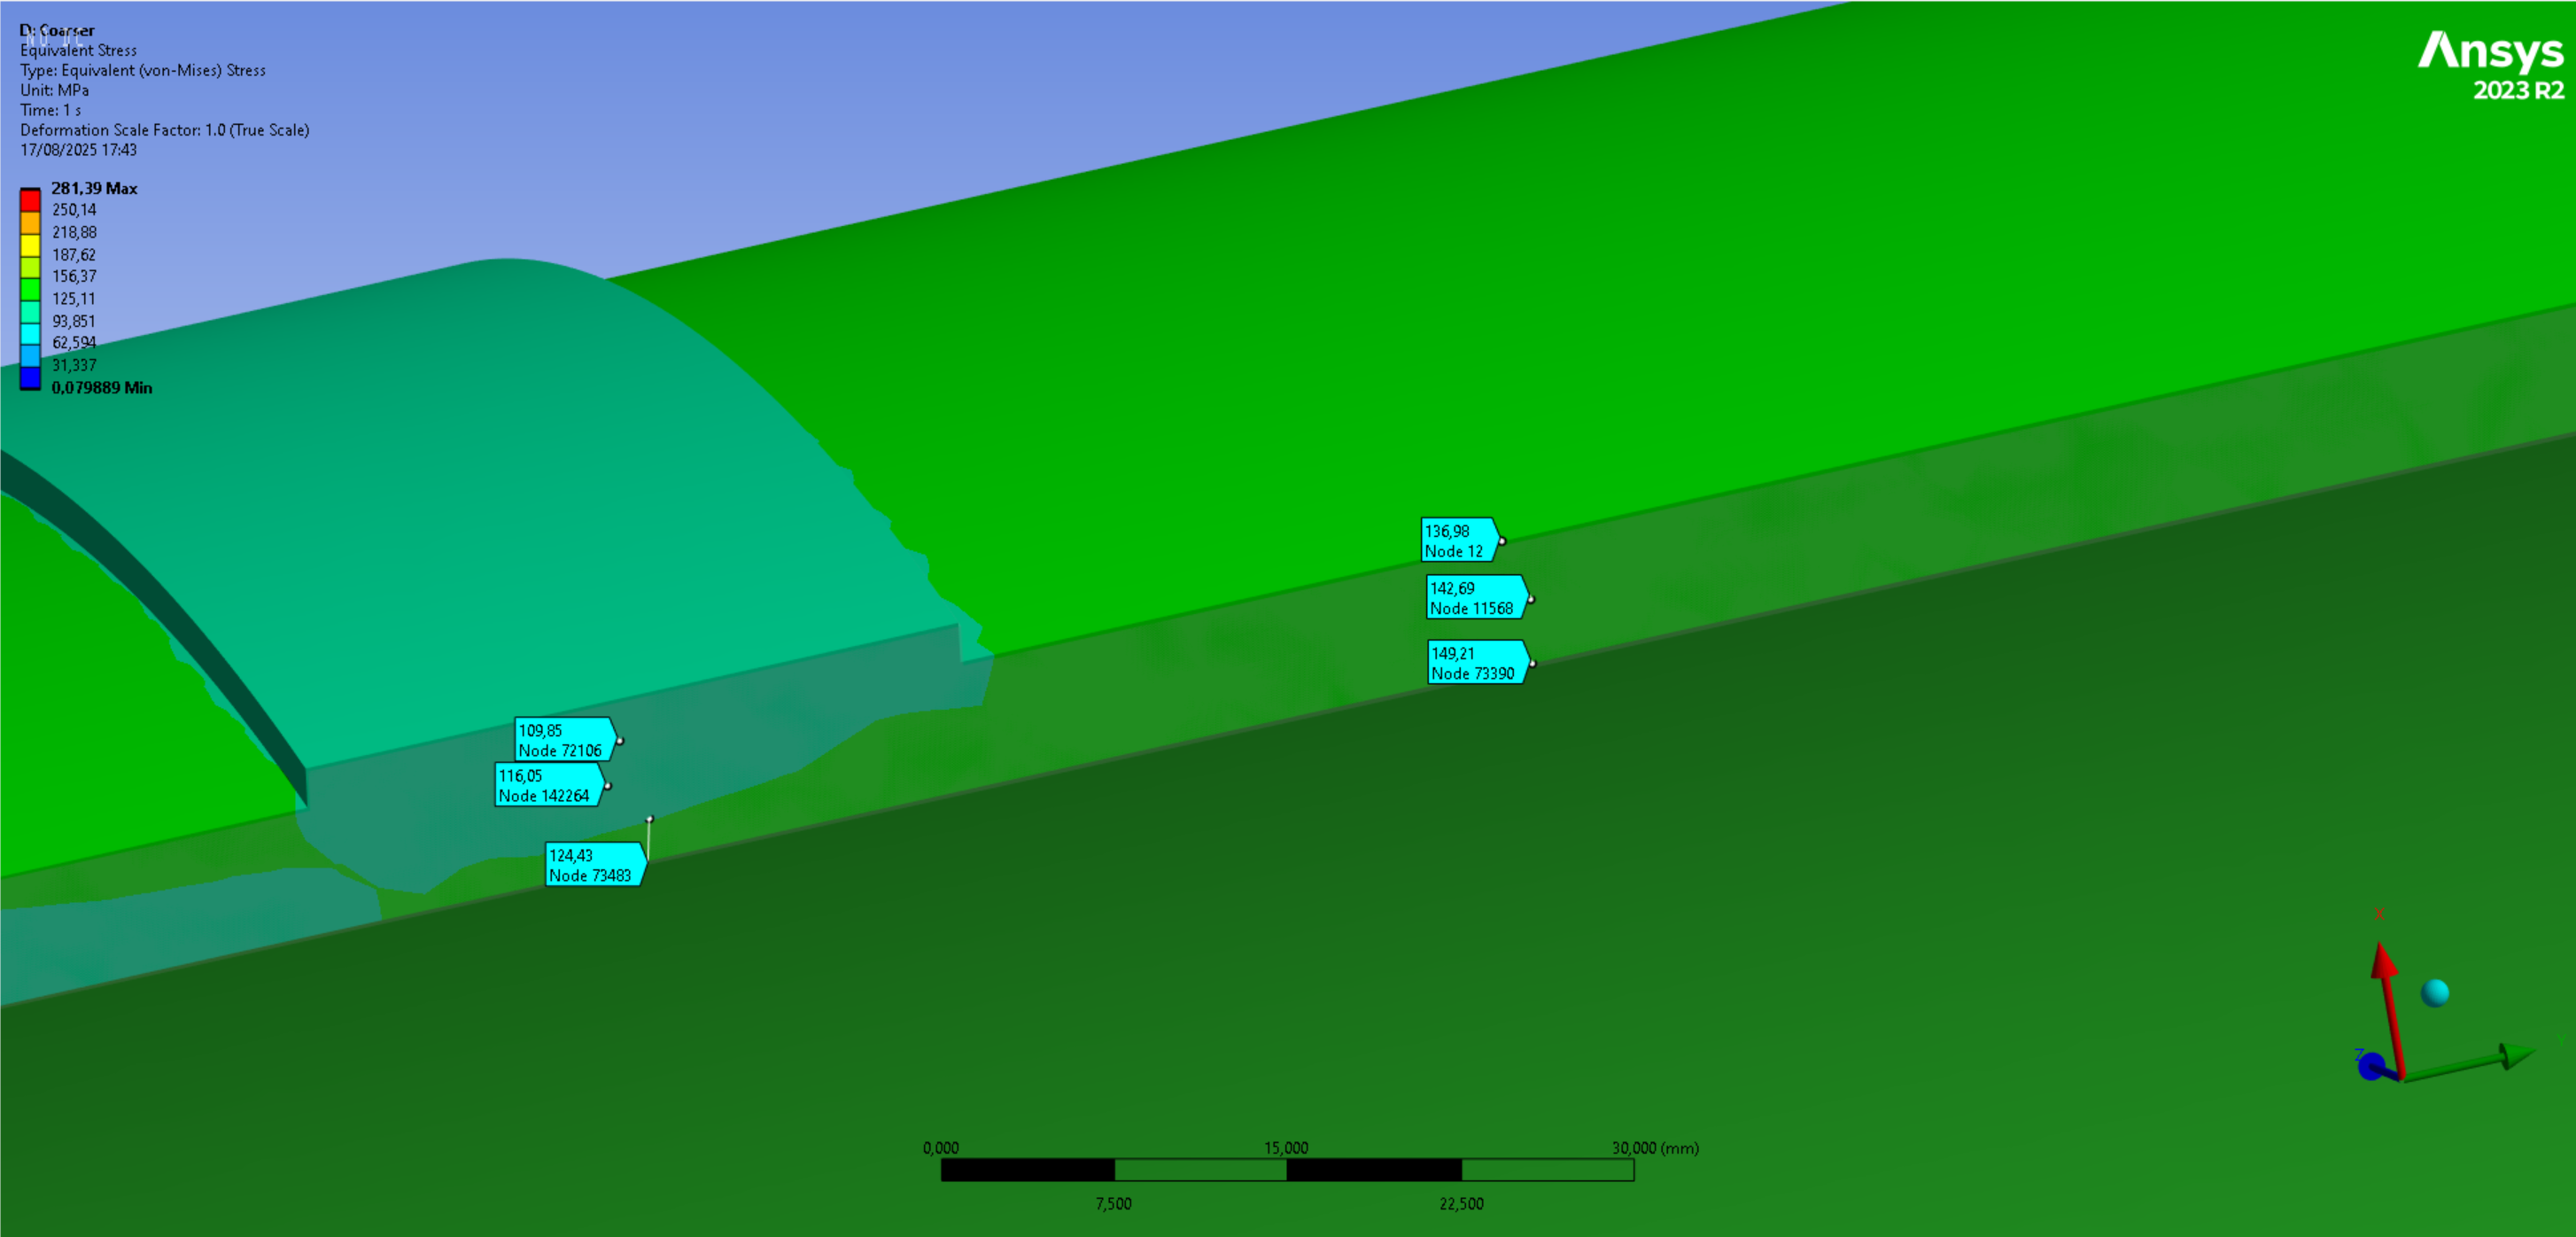
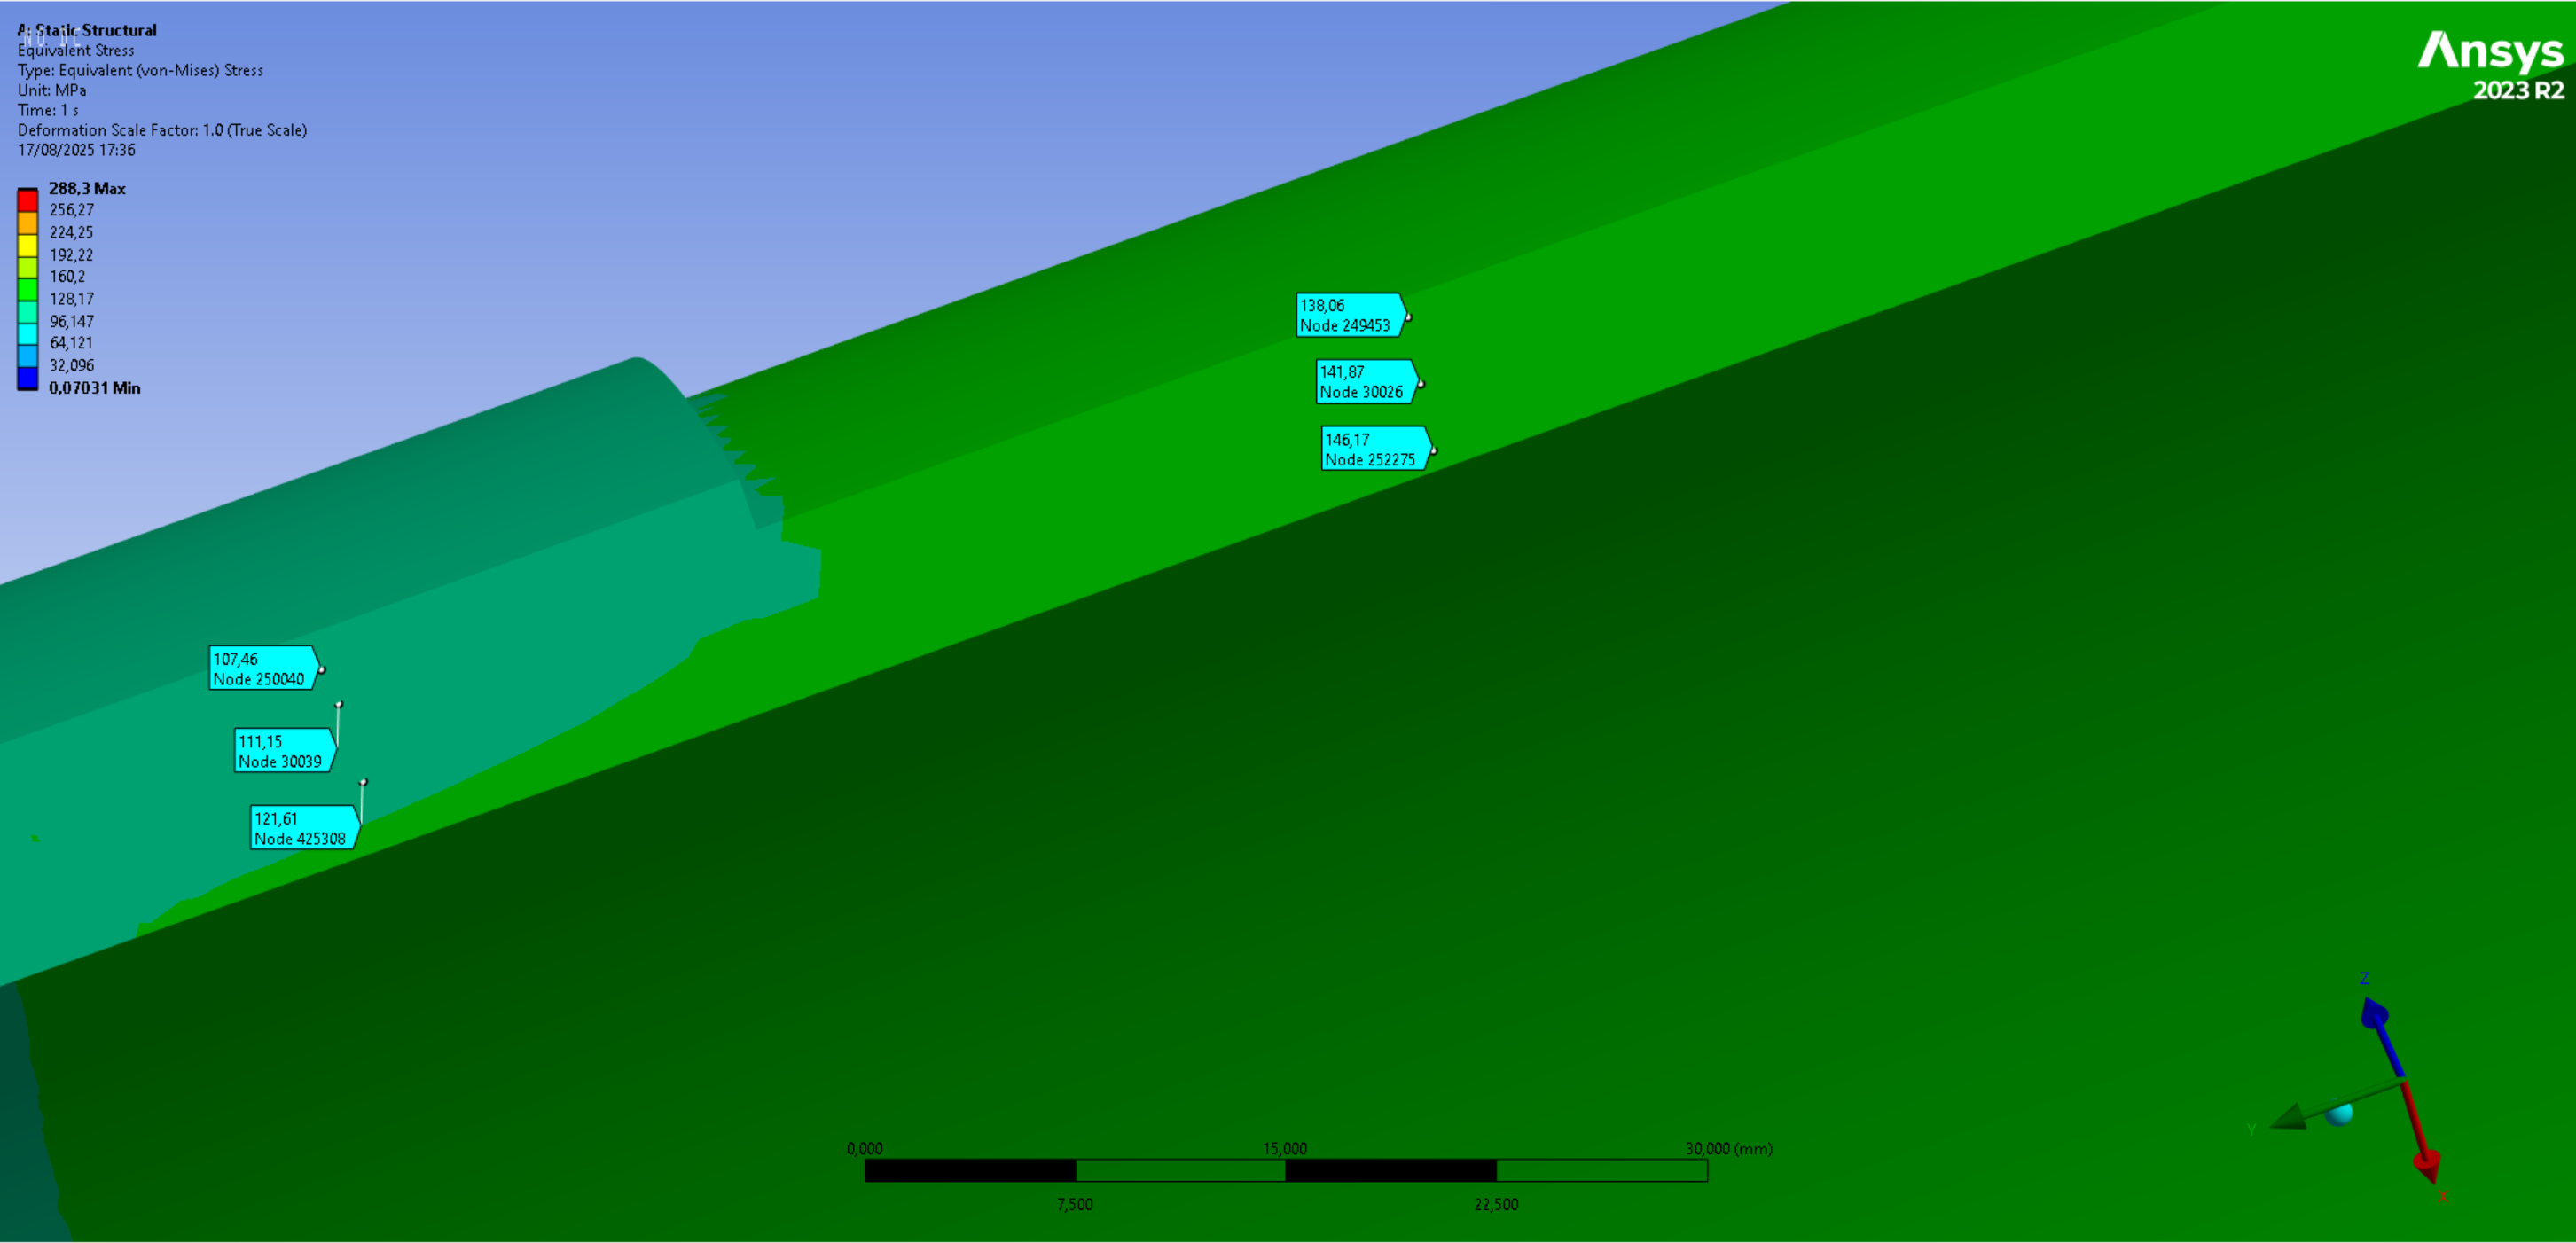
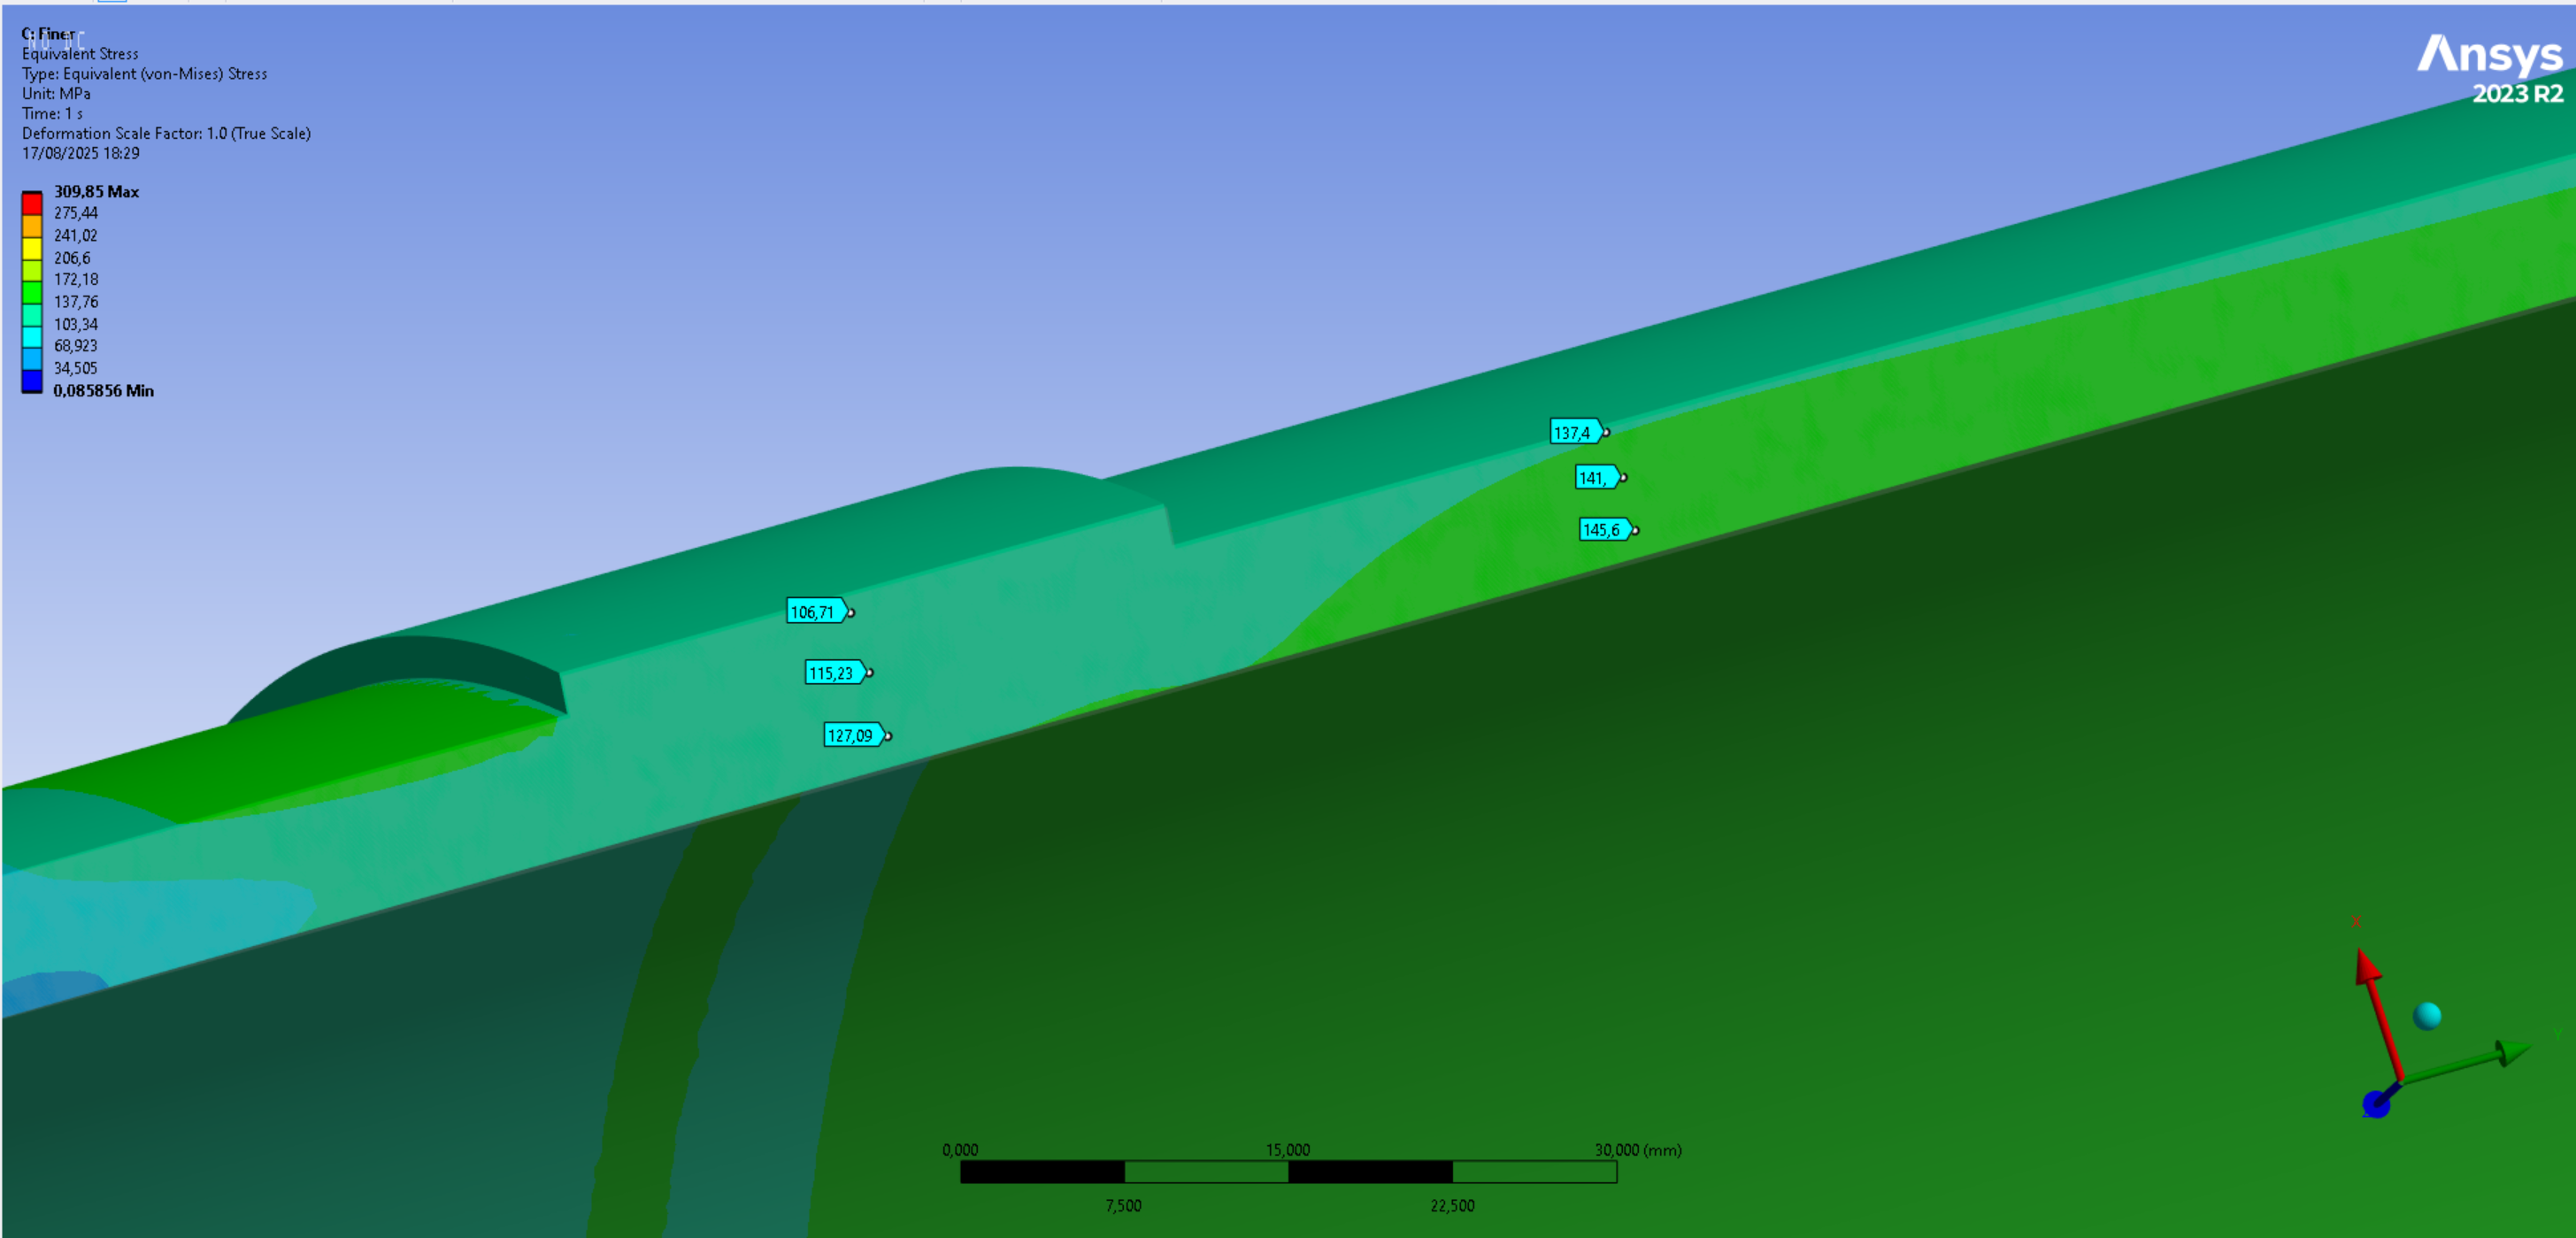
The stresses in the cylindrical part of the tank were used as the convergence criterion. For this, both the stresses at the reinforced weld location and at the regular thickness cylindrical part were considered.
|:---:---:---:---:---
|Size|Coarser (2.5mm)|Initial (1.5mm)|Finer (1mm)|
Von Mises Stress in thicker part [MPa]|116.05|111.15|115.23|
Deltas [%]|+4.4| - |+3.7|
Von Mises Stress in thinner part [MPa]|142.69|141.87|141.00|
Deltas [%]|+0.6| - |-0.6|
It can be seen that the solution has converged because it's variation is within a 5[%] margin. In fact, the "large" variation in the thicker part of the tank is due to the fact that the nodes for stress evaluation have to be selected by hand, and as can be seen it the following images, it was rather difficult to place them at the same spot for all three meshes.
It seems that the coarser mesh is even sufficient for this analysis, but the initial mesh was nevertheless selected to continue the analysis.
Von Mises Averaged contour for the coarser mesh, the initial mesh and the finer mesh:
This is the final mesh that was used. It contains 973190 Tet10 elements.
¶ Outputs
Only the Von Mises stress and the total displacement were considered, as no other quantity was deemed useful for decision making or comparison with real world data.
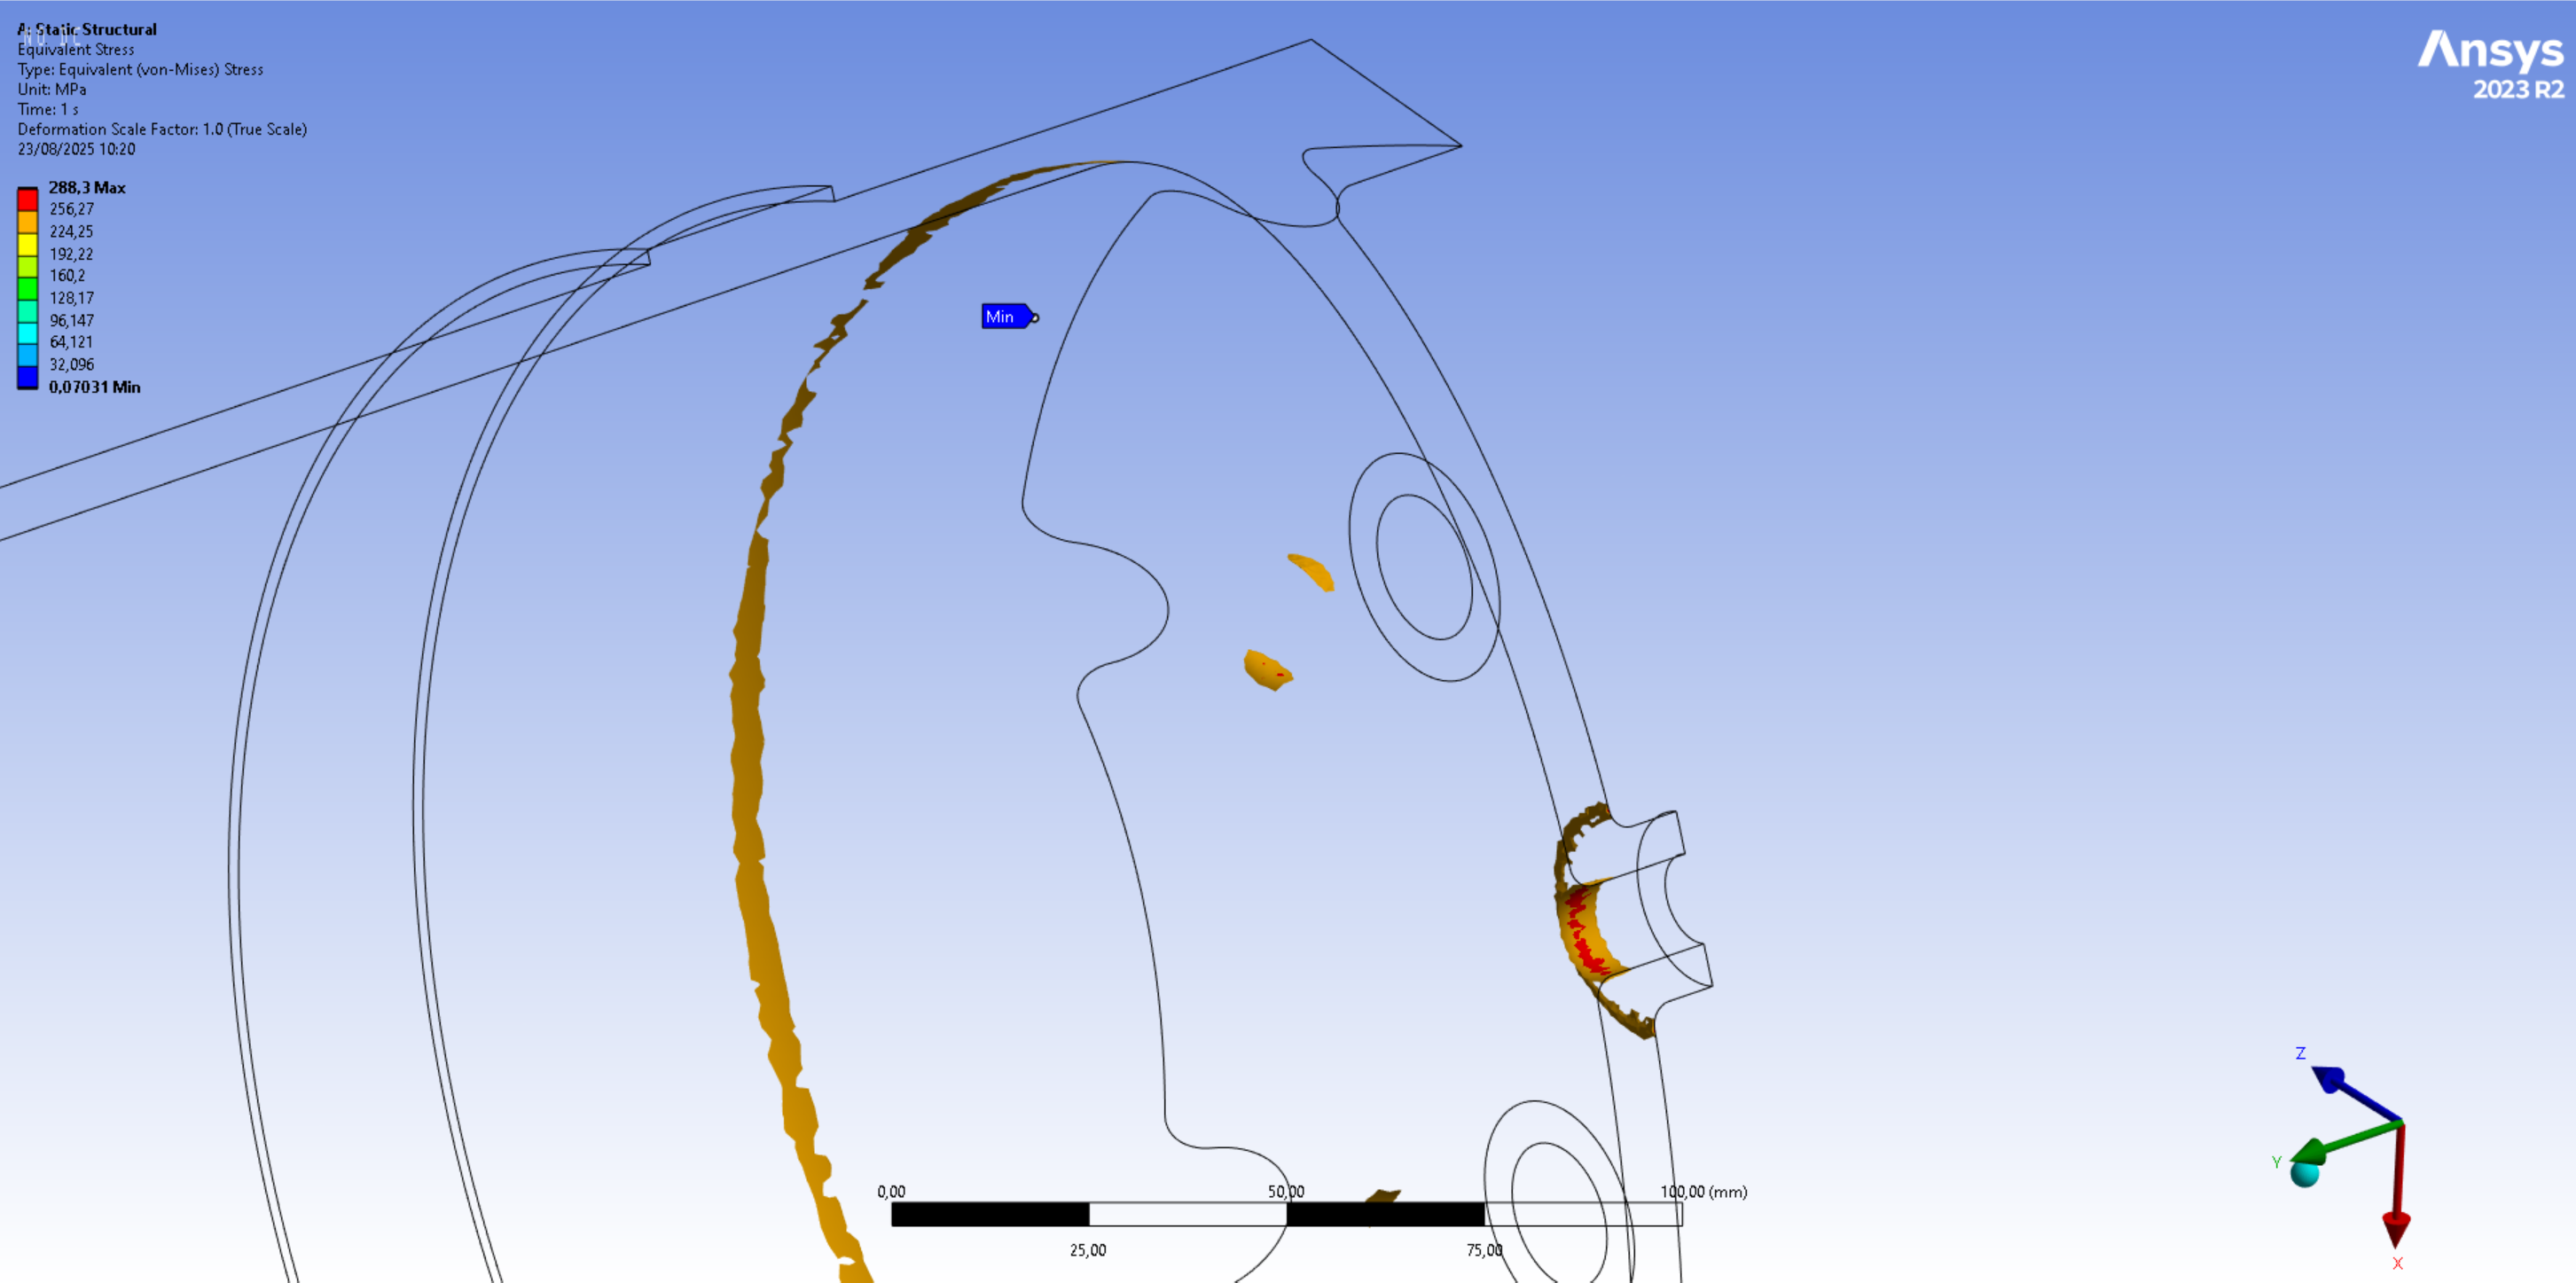
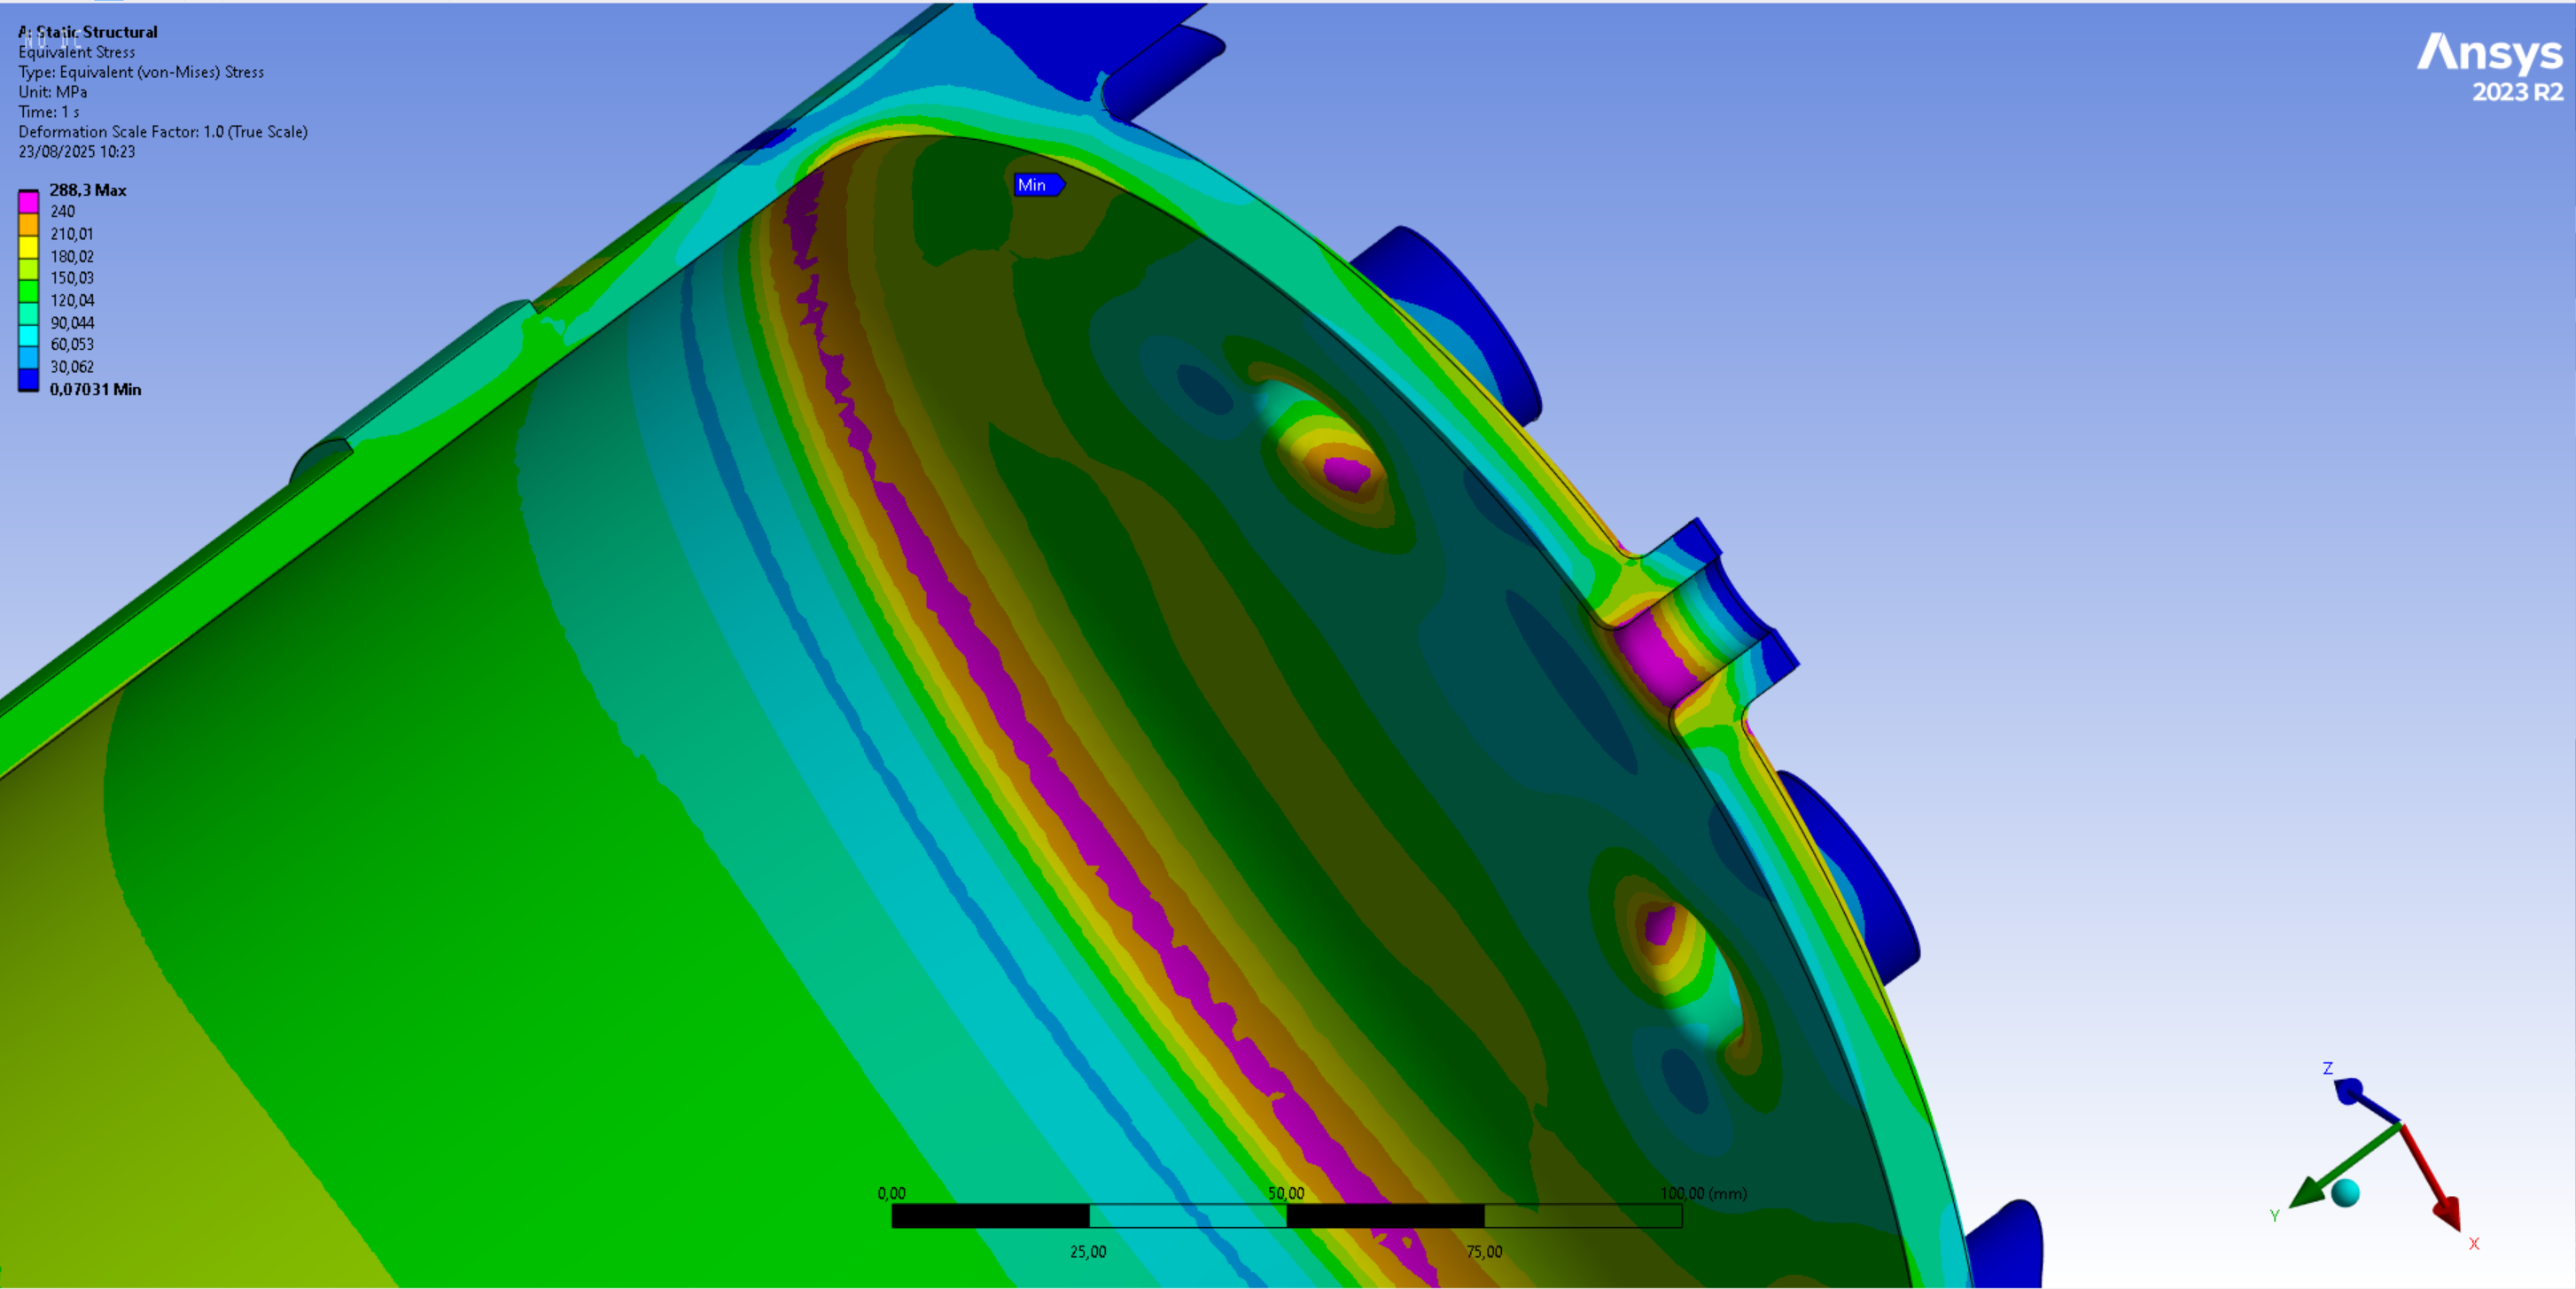
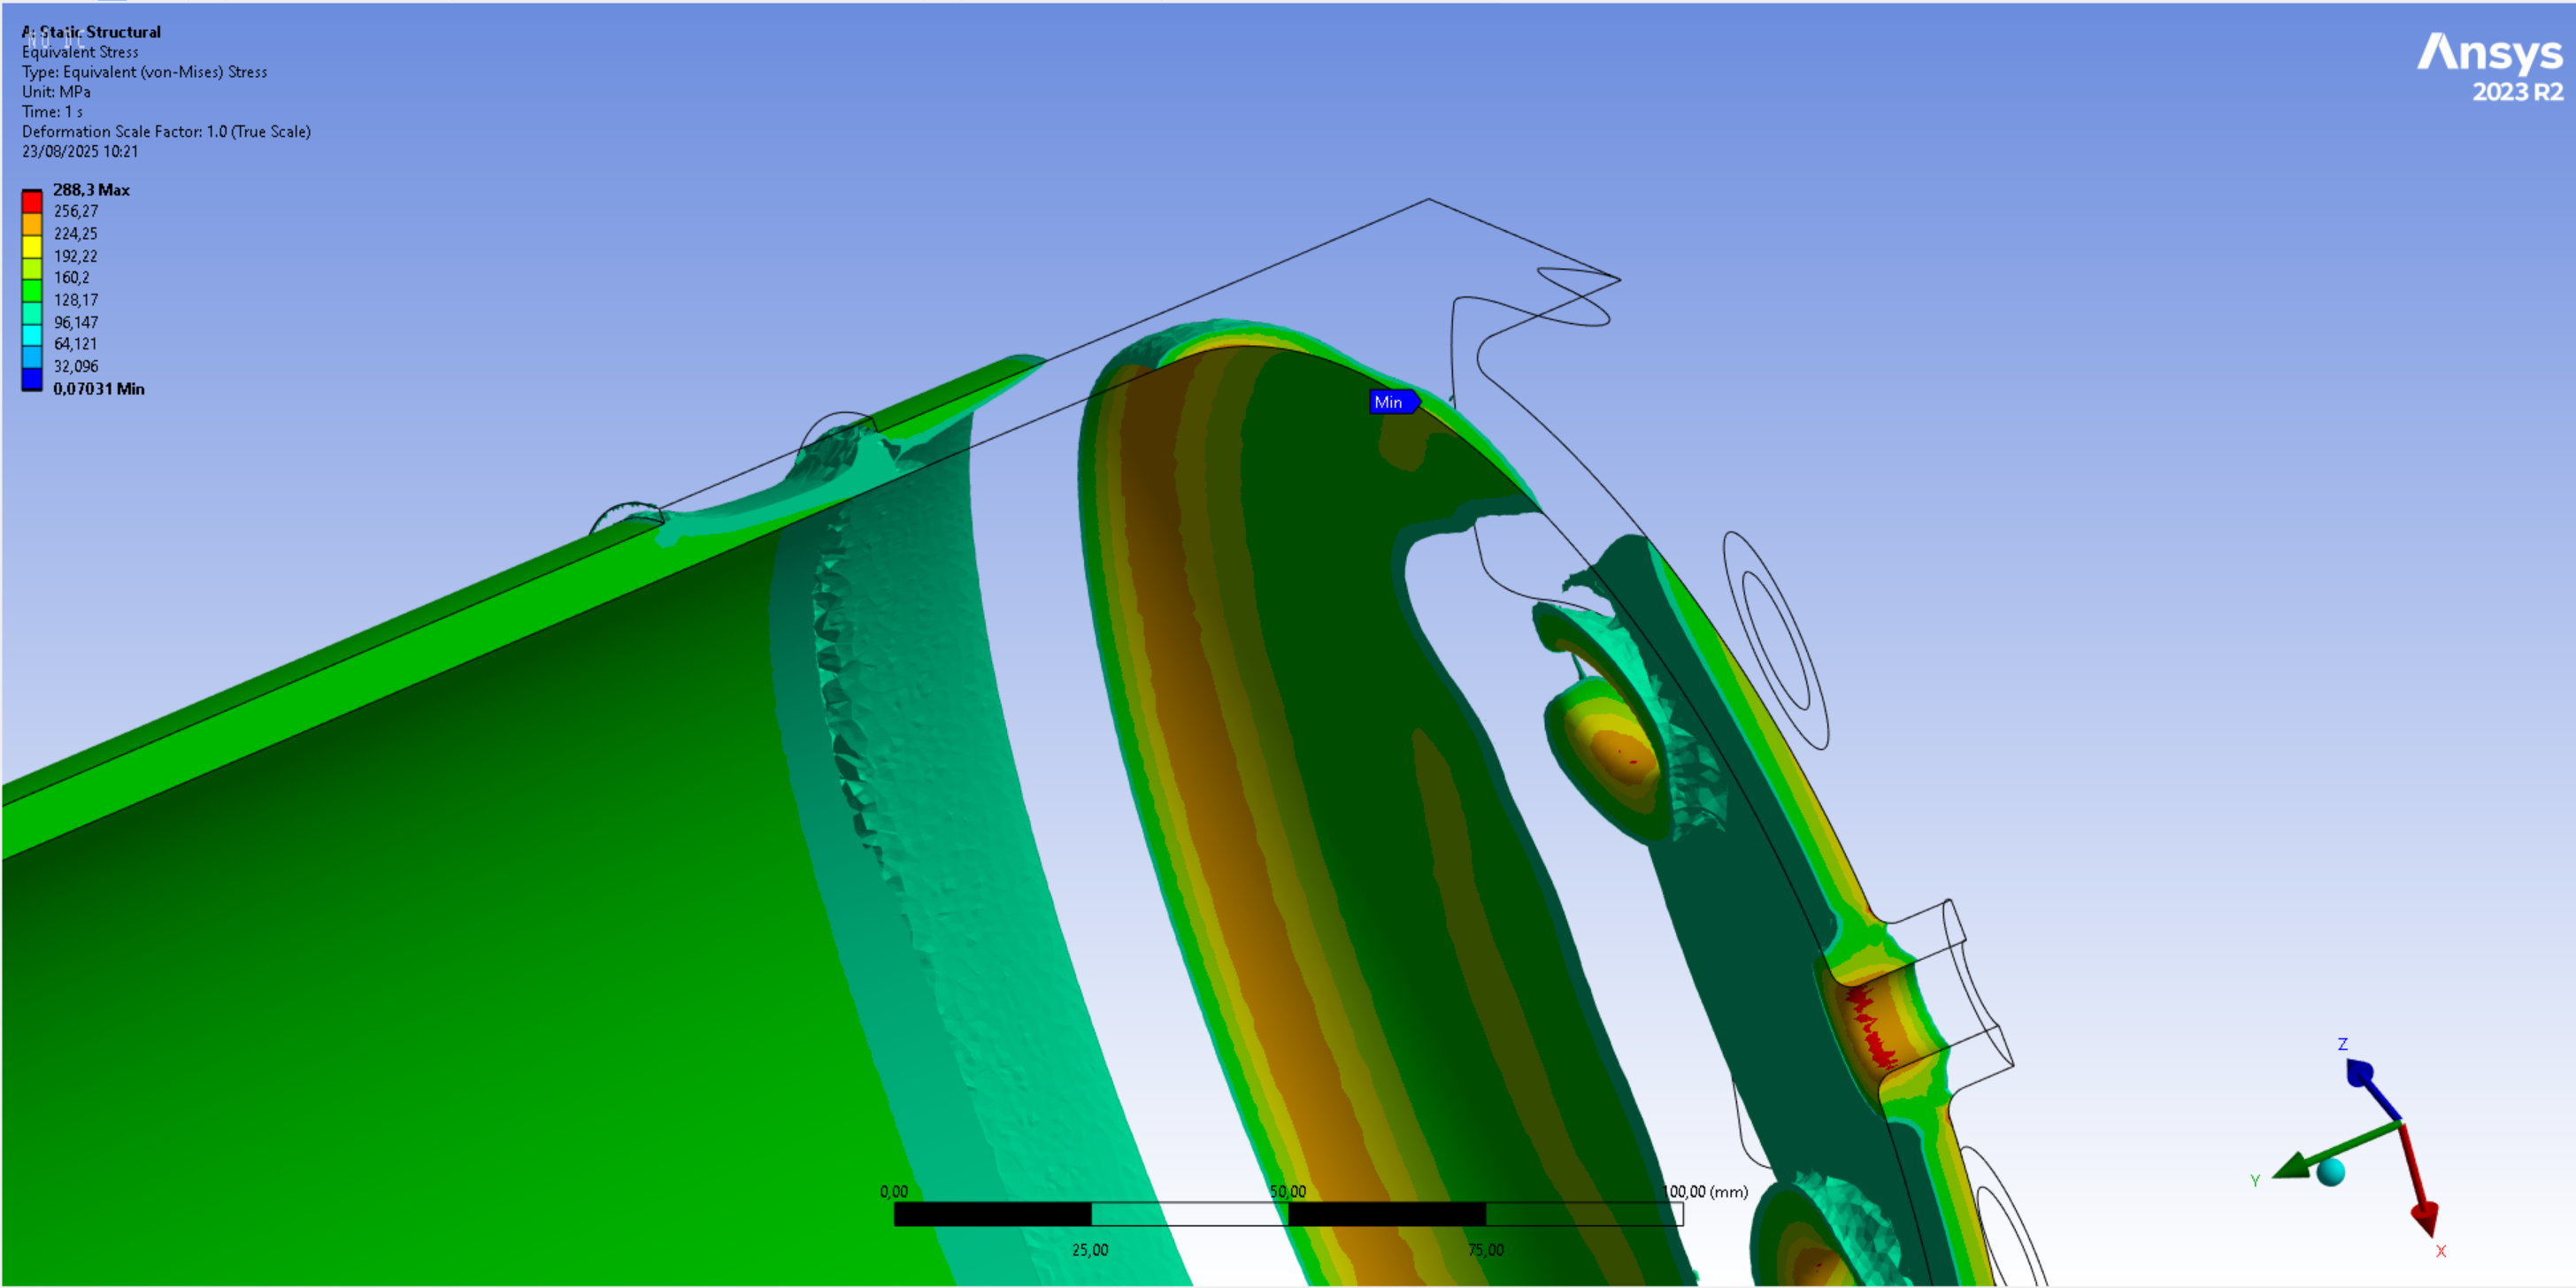
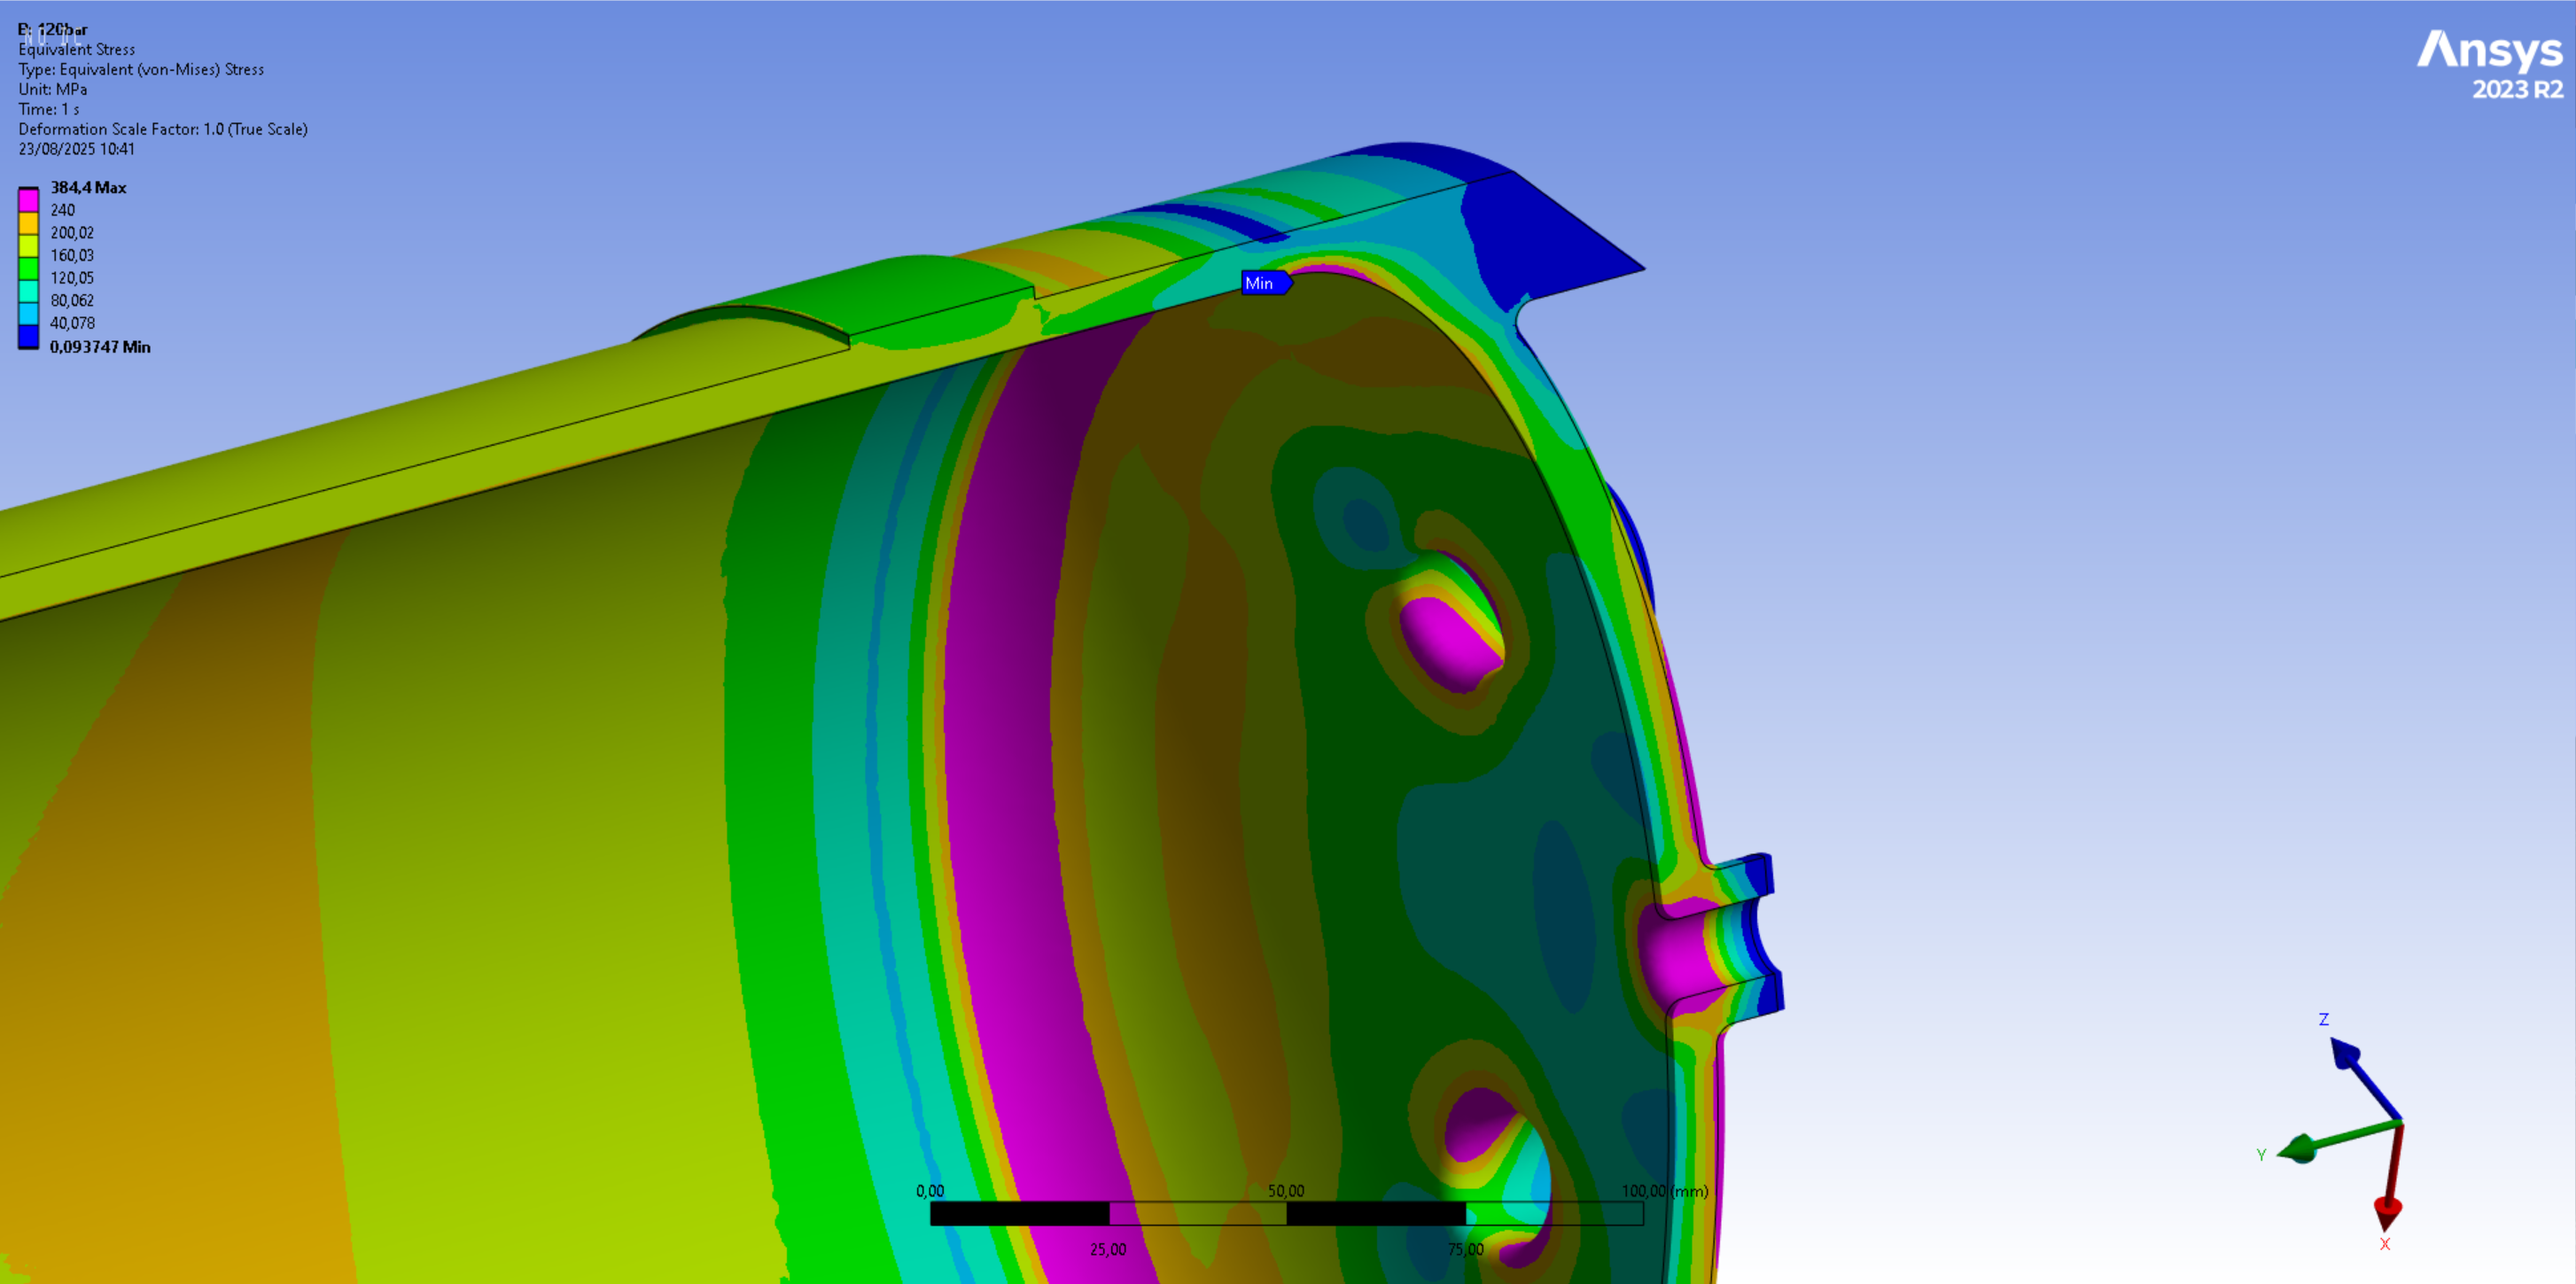
The following 2 images display the averaged Von Mises stress contours that exceed the material yield strength of 240[MPa]. In the first image, only the elements that exceed this value are displayed, while in the second image, all elements that exceed this value are displayed in purple.
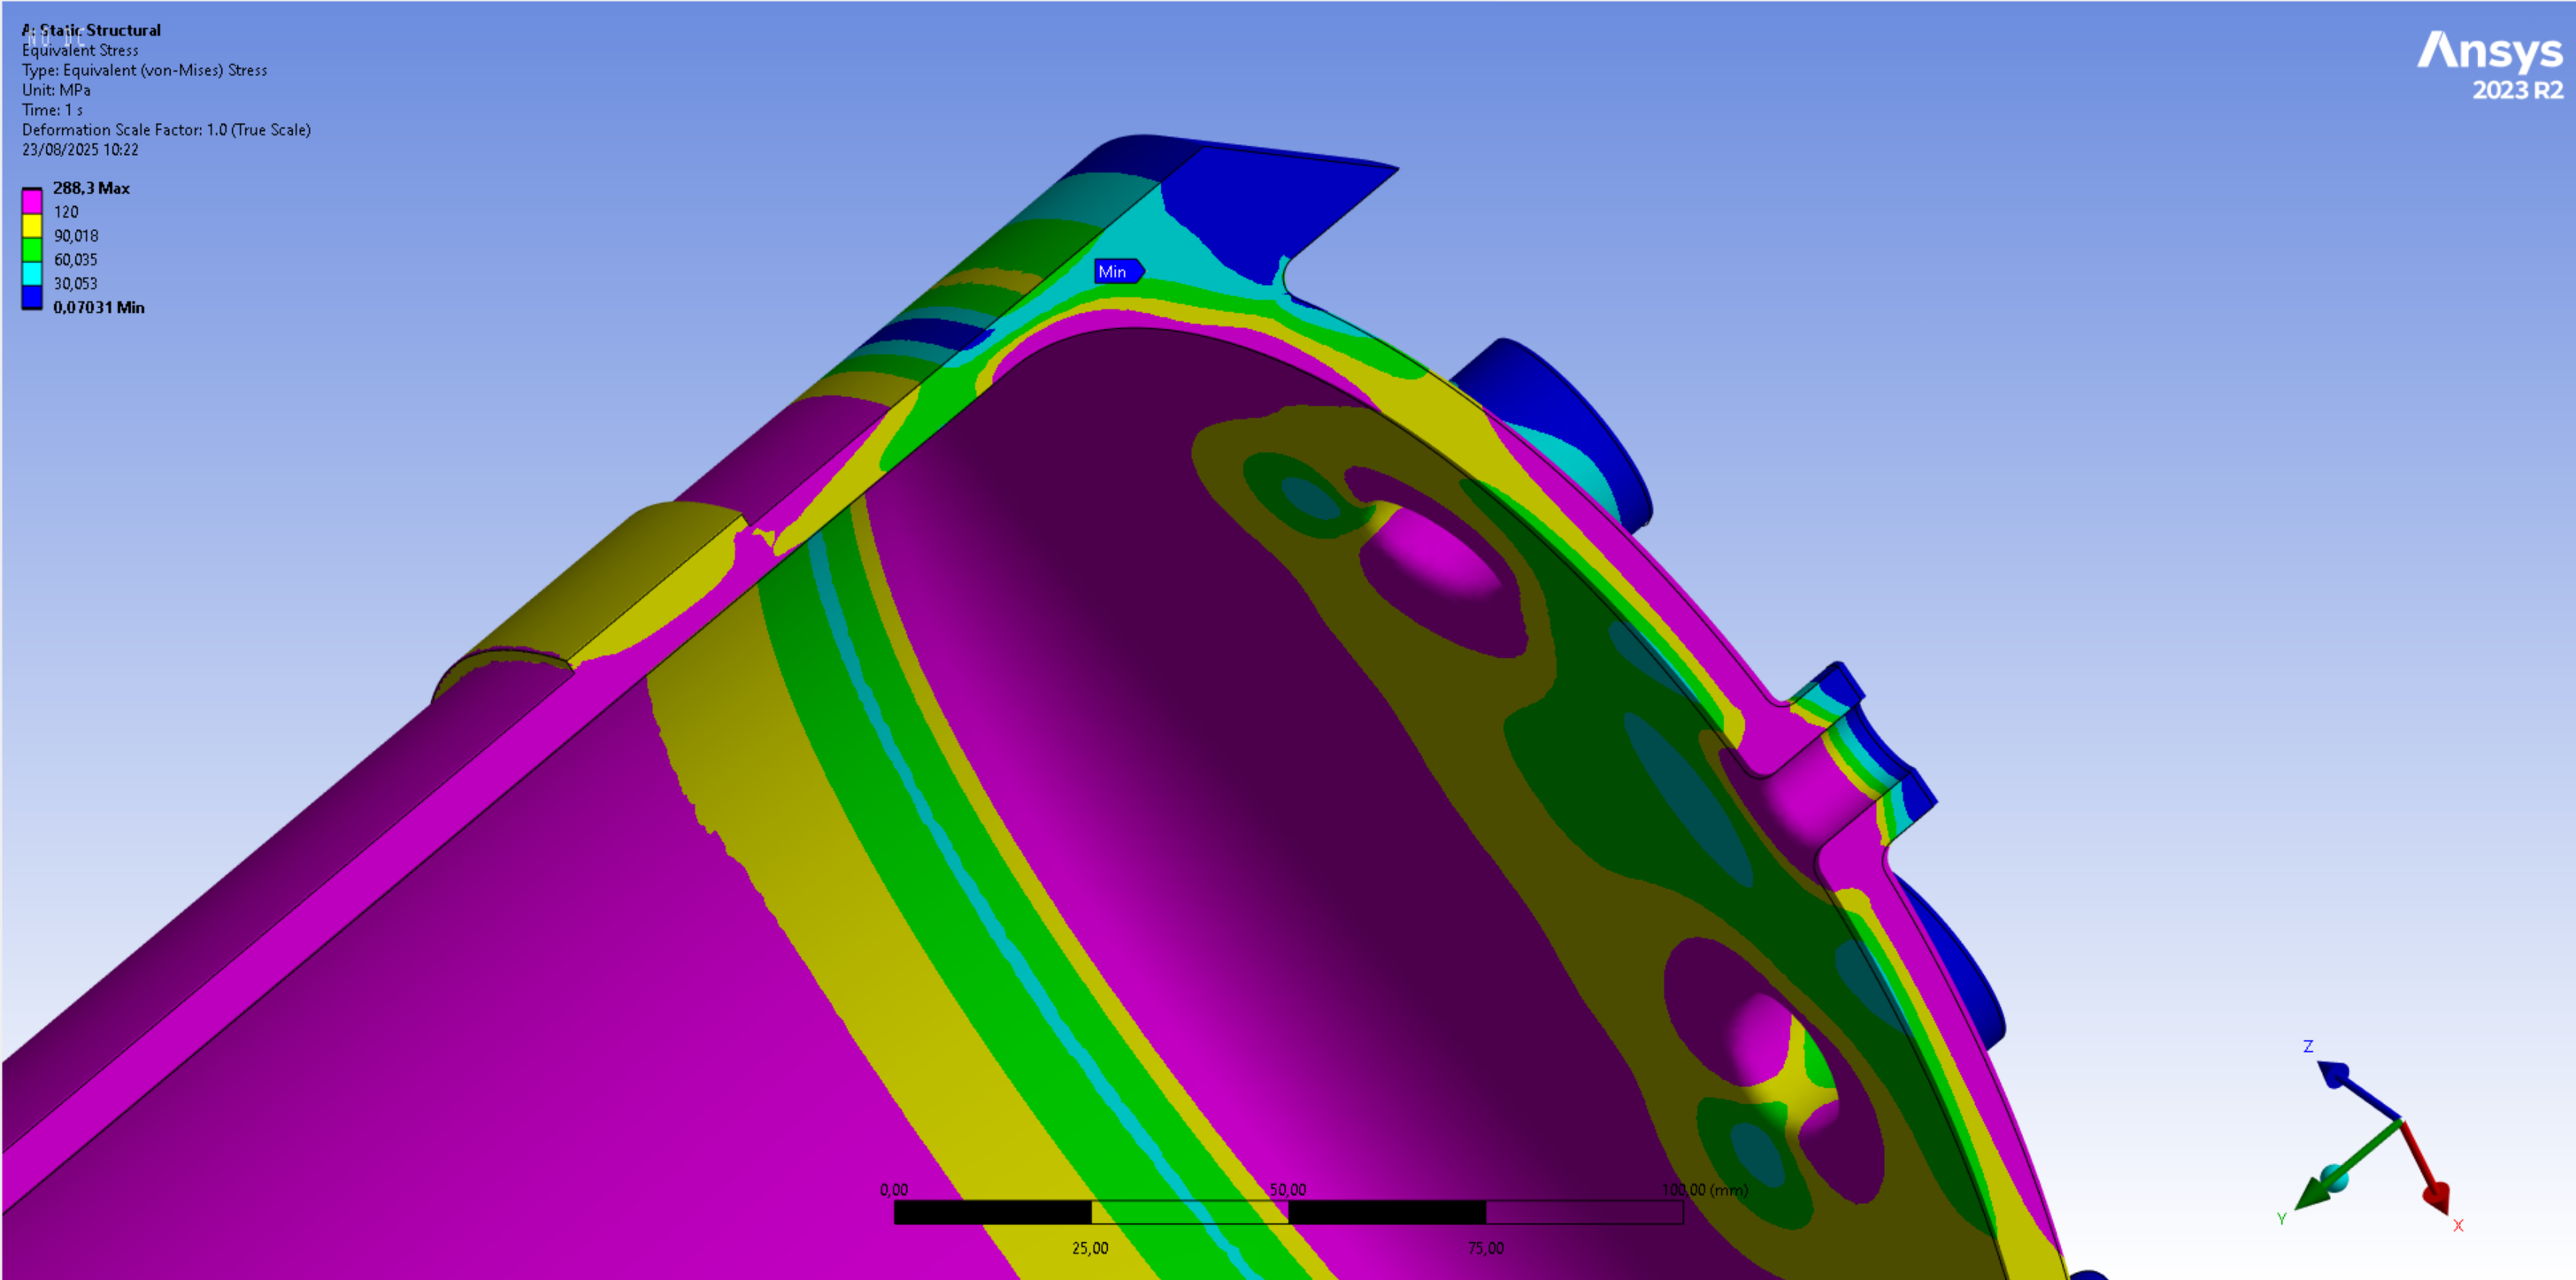
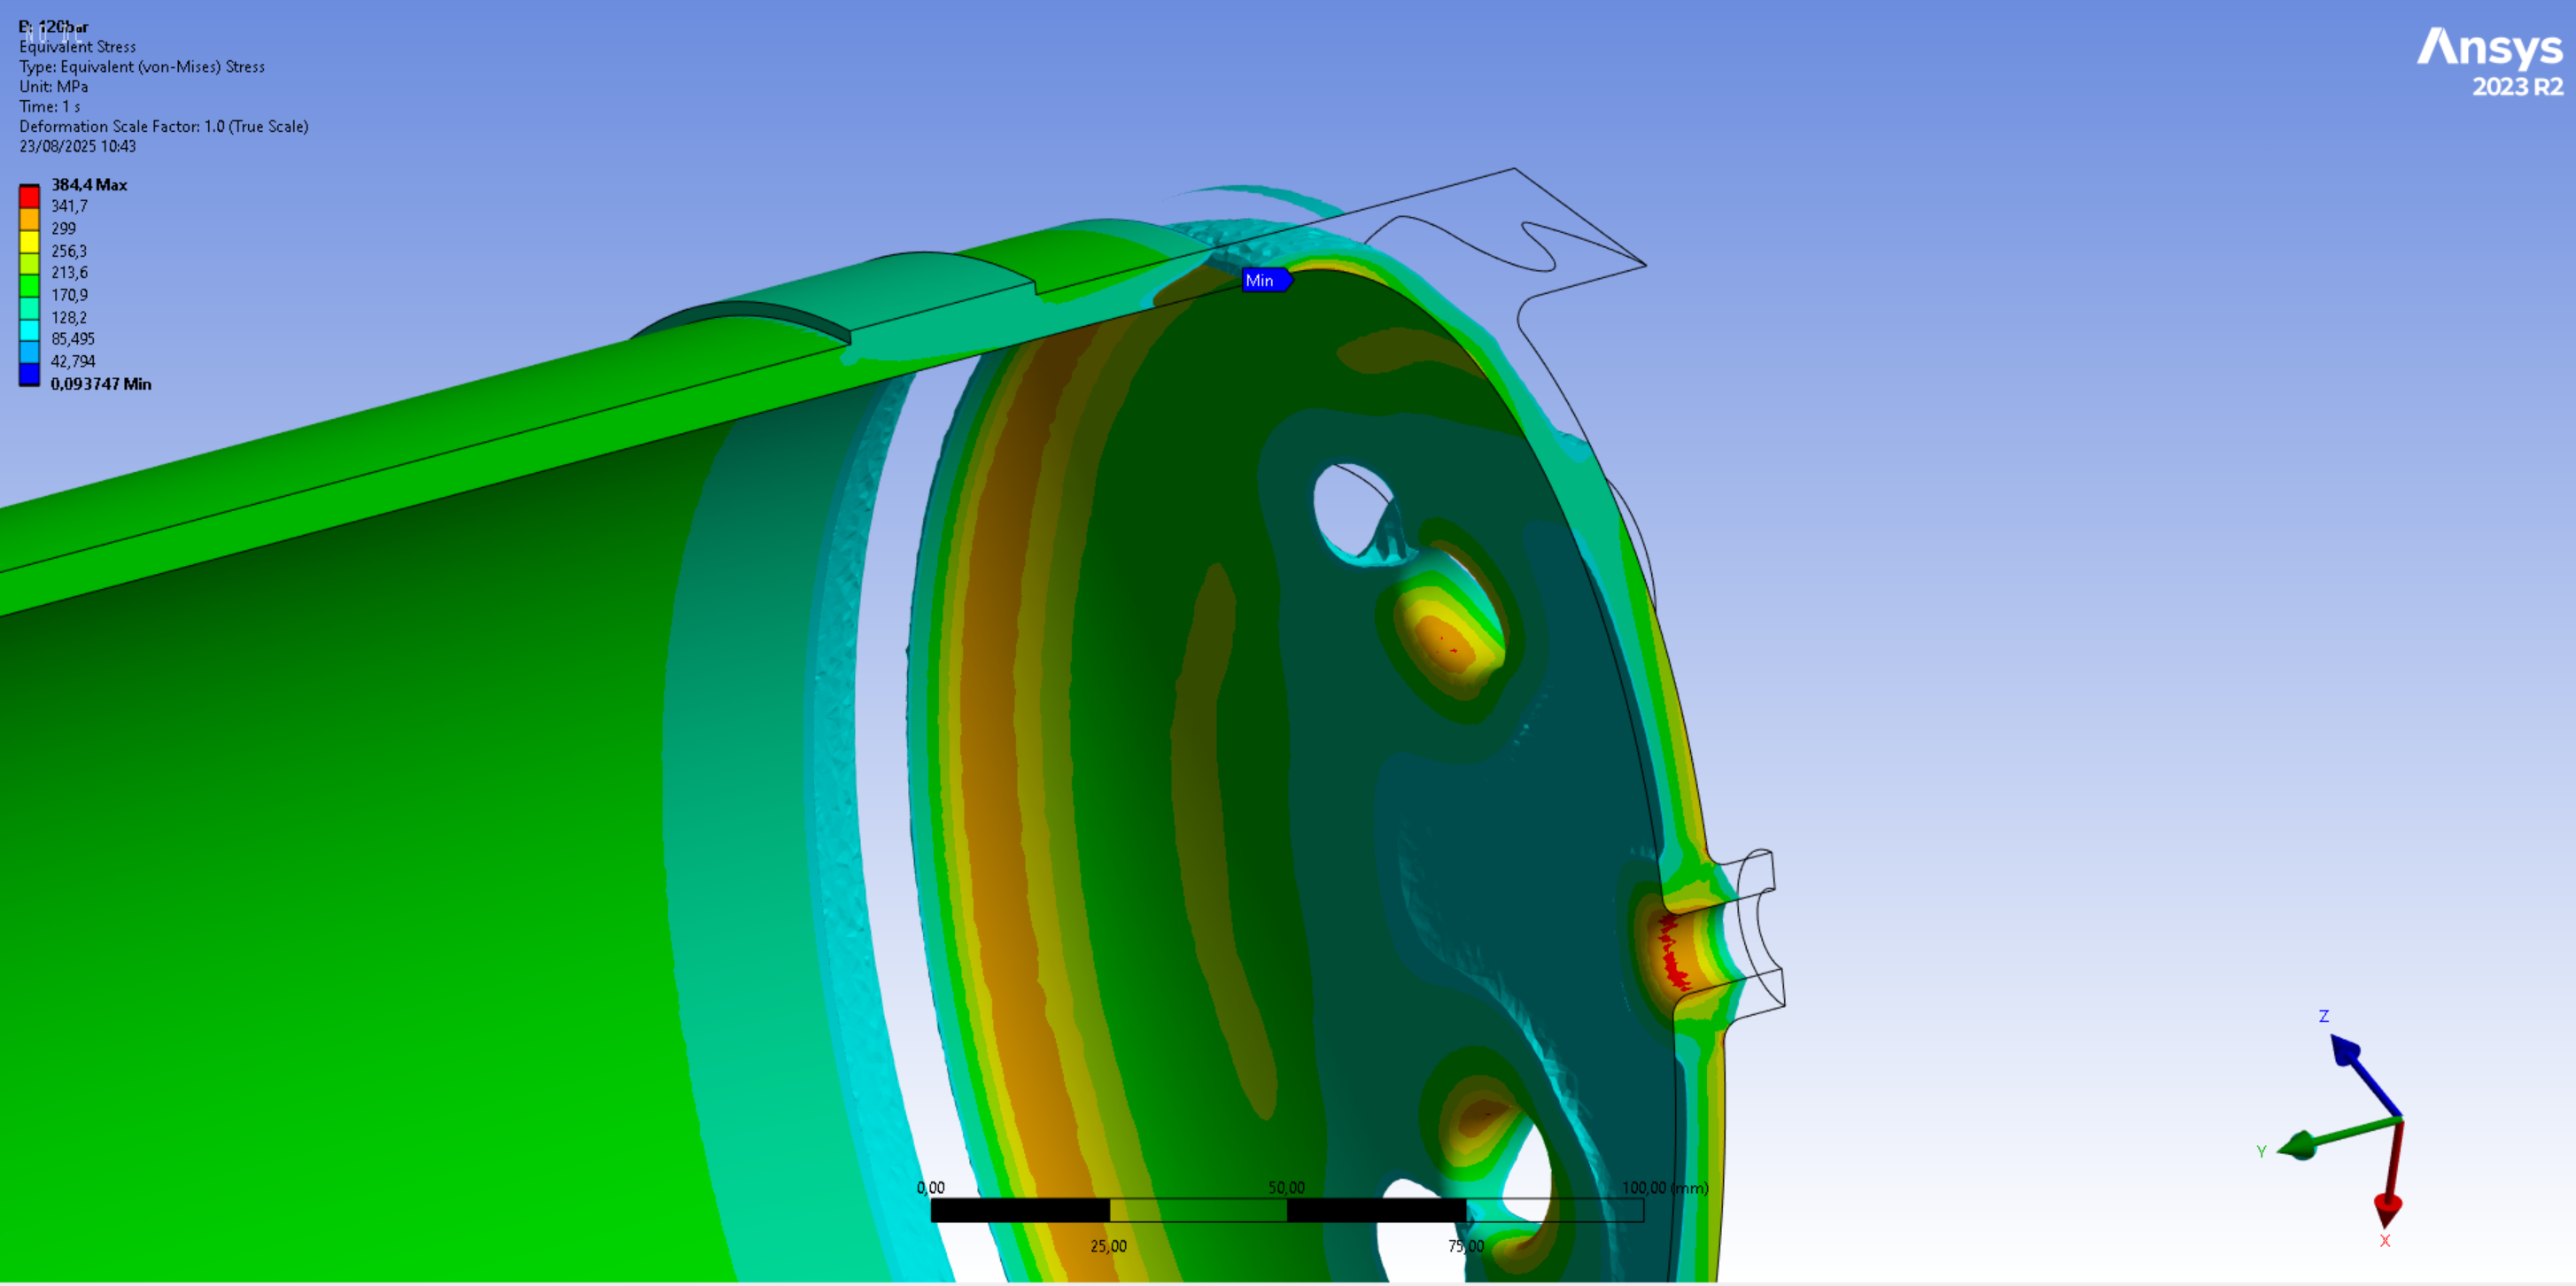
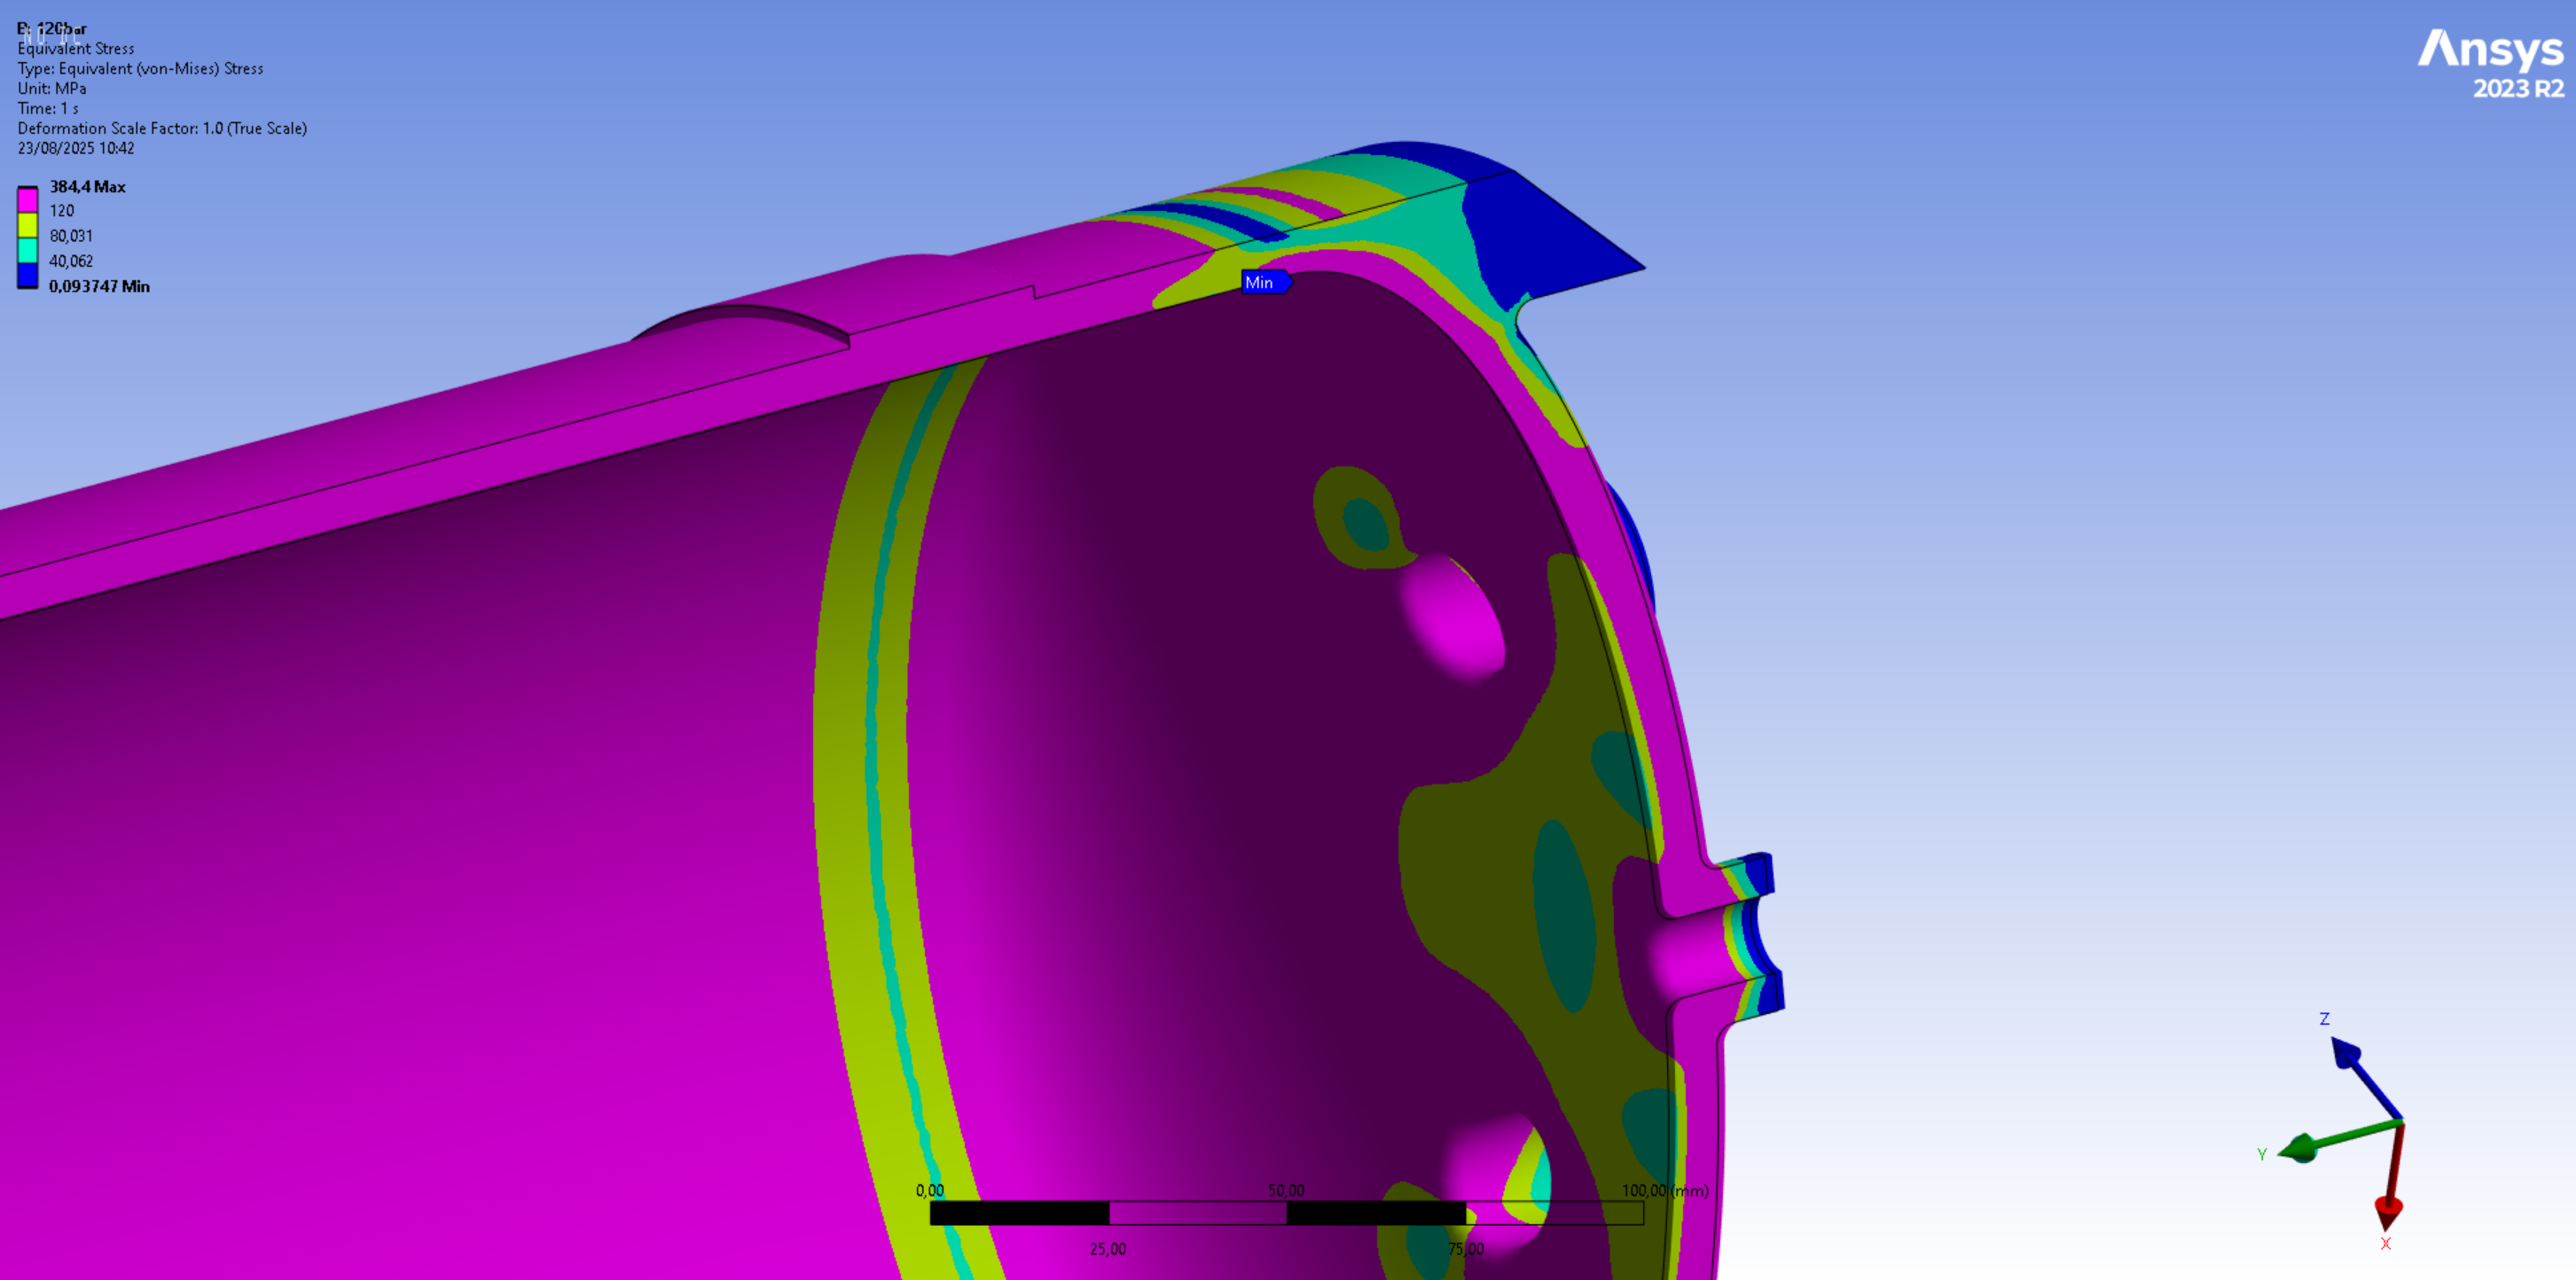
The next 2 images display the averaged Von Mises stress contours that exceed the expected weld yield strength of half the original material yield strength, which corresponds to a value of 120[MPa].
It can be seen in the first set of images that only small parts of the tank geometry will be affected by plasticity. These small plastification areas are expected to be completely negligible to the tank's nominal operations.
It can be seen in the second set of images that a significant part of the weld area/Heat Affected Zone (HAZ) exceeds the threshold of expected material yield strength.
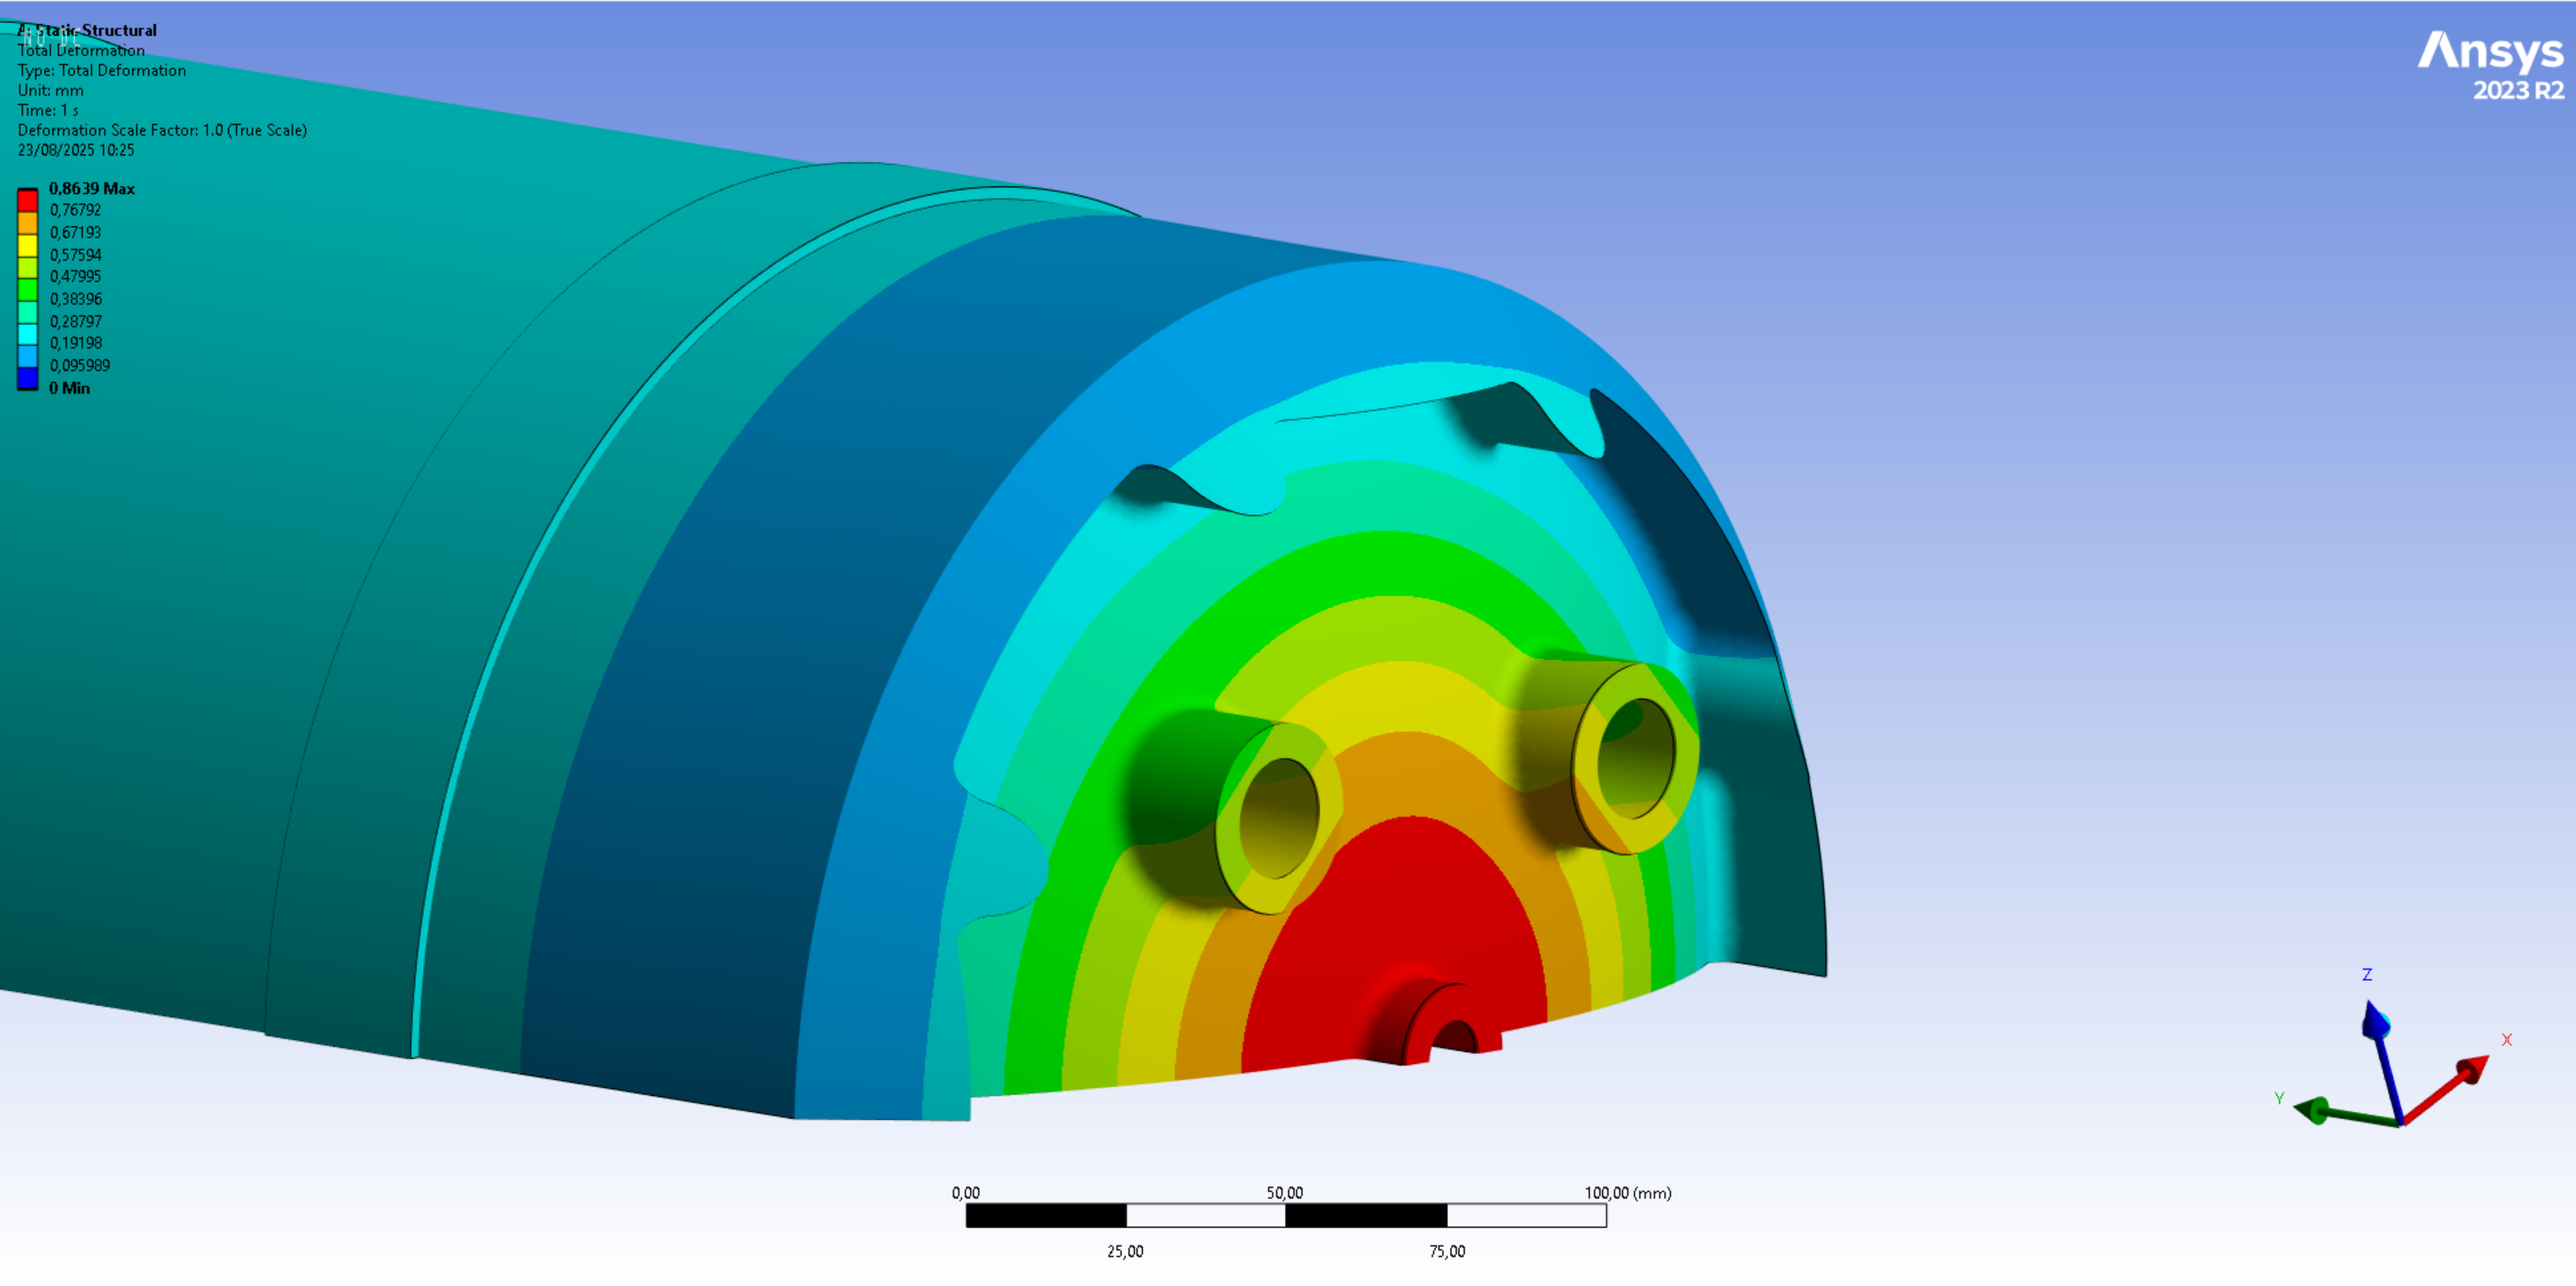
The total displacement is displayed to assess whether the 90bar load case results in deformation that are detrimental to the tank mechanical interfaces. As expected, maximum deformation occurs at the 'tip' of the tank caps. Its maximum value is less than a milimeter. While no clear numerical thershold has been defined for the total deformation, it can confidently be said that this value shouldn't result in any issues with regards to the plumbing interface, such as creating unacceptable compressive stresses in the G1/4 plumbing attached to the tank.
The following 2 images display the averaged Von Mises stress contours that exceed the material yield strength of 240[MPa]. In the first image, only the elements that exceed this value are displayed, while in the second image, all elements that exceed this value are displayed in purple.
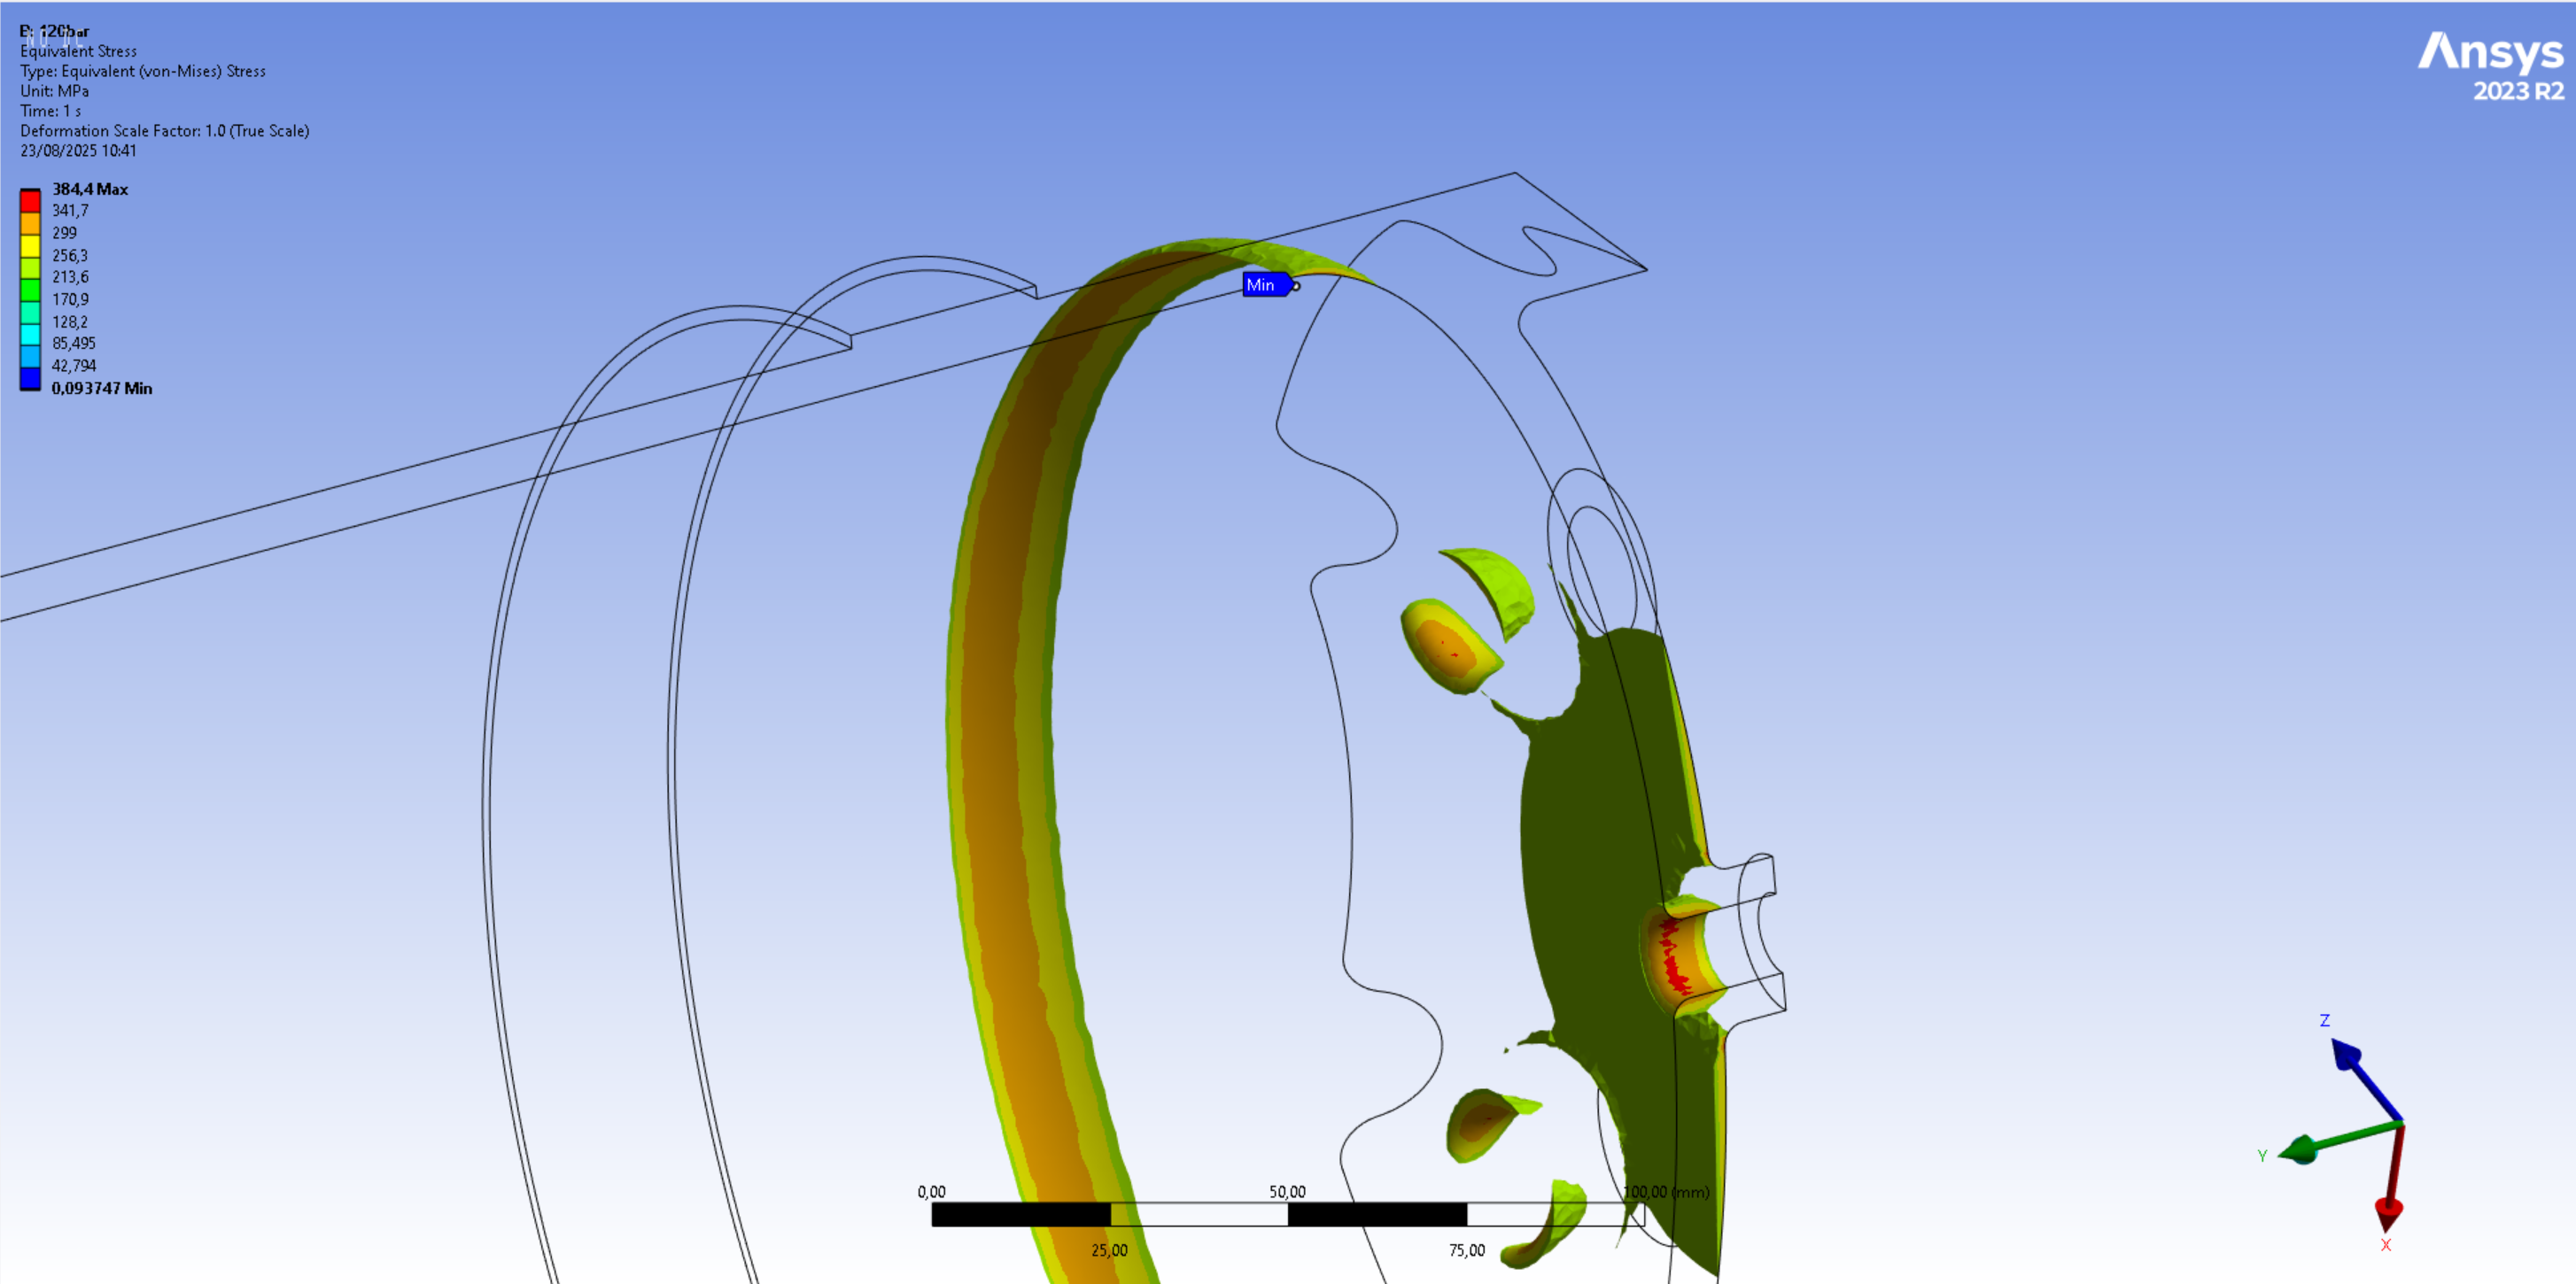
The next 2 images display the averaged Von Mises stress contours that exceed the expected weld yield strength of half the original material yield strength, which corresponds to a value of 120[MPa].
Since no MoS is applicable to these load cases as it is only necessary to assess if the weld "holds or not", no summary of MoS is presented here. Instead, the simulation results are interpreted in the next section.
¶ Interpretation
¶ Simulation validity
The validity of the simulation can be verified by calculating by hand the stress found in the cylindrical main body of the tank and comparing it to the results of the simulation.
The following equation for the maximal principal stress in a cylindrical pressure vessel give:
With being the internal pressure in the tank, the radius of the cylinder, the thickness of the cylinder and the thickness at the weld reinforced section.
Plugging in these values in the equation gives us the following result:
for the 6.5mm section, and
for the 8.5mm section at the reinforced weld location.
When comparing with the results previously obtained, there is a significant difference. This is likely due to the extra thickness section at the weld location, which violates the hypothesis used to derived the thin cylinder formulas. In fact, when running the exact same setup without this extra thickness (constant thickness cylinder), we obtain results that closely match the formulas used above (not shown here, but see 2024_C_ST_TANKS_FEA_SR for an example).
Because mesh independency has been demonstrated, because the setup used has been shown to create accurate results in the past, and because the results of this simulation fall within a reasonable difference from hand calculations, the simulationr esults are considered valid and usable for decision making.
¶ Conculsions
From the simulation results, the following observations can be made:
- at 90[bar], the stresses exceed the expected welded material yield strength of 120[MPa] in about half of the weld geometry/HAZ thickness
- at 120[bar], the stresses exceed the expected welded material yield strength of 120[MPa] in the entirety of the weld geometry/HAZ thickness
Therefore, the following conclusions can be drawn:
- it can be assumed that the tank can withstand its Maximum Design Pressure (MDP) of 90[bar], which means that 2024_C_SE_ST_TANK_REQ_09 is verified by analysis
- it can be assumed that the tank cannot withstand its design burst pressure of 120[bar], which means that 2024_C_SE_ST_TANK_REQ_26 is not verified by analysis
And the following points are recommanded:
- because half of the HAZ exceeds 120[MPa] for an internal pressure of 90[bar], the tank should only be pressurized to this value for the qualification test, otherwise there is a risk of failure in fatigue over very few cycles